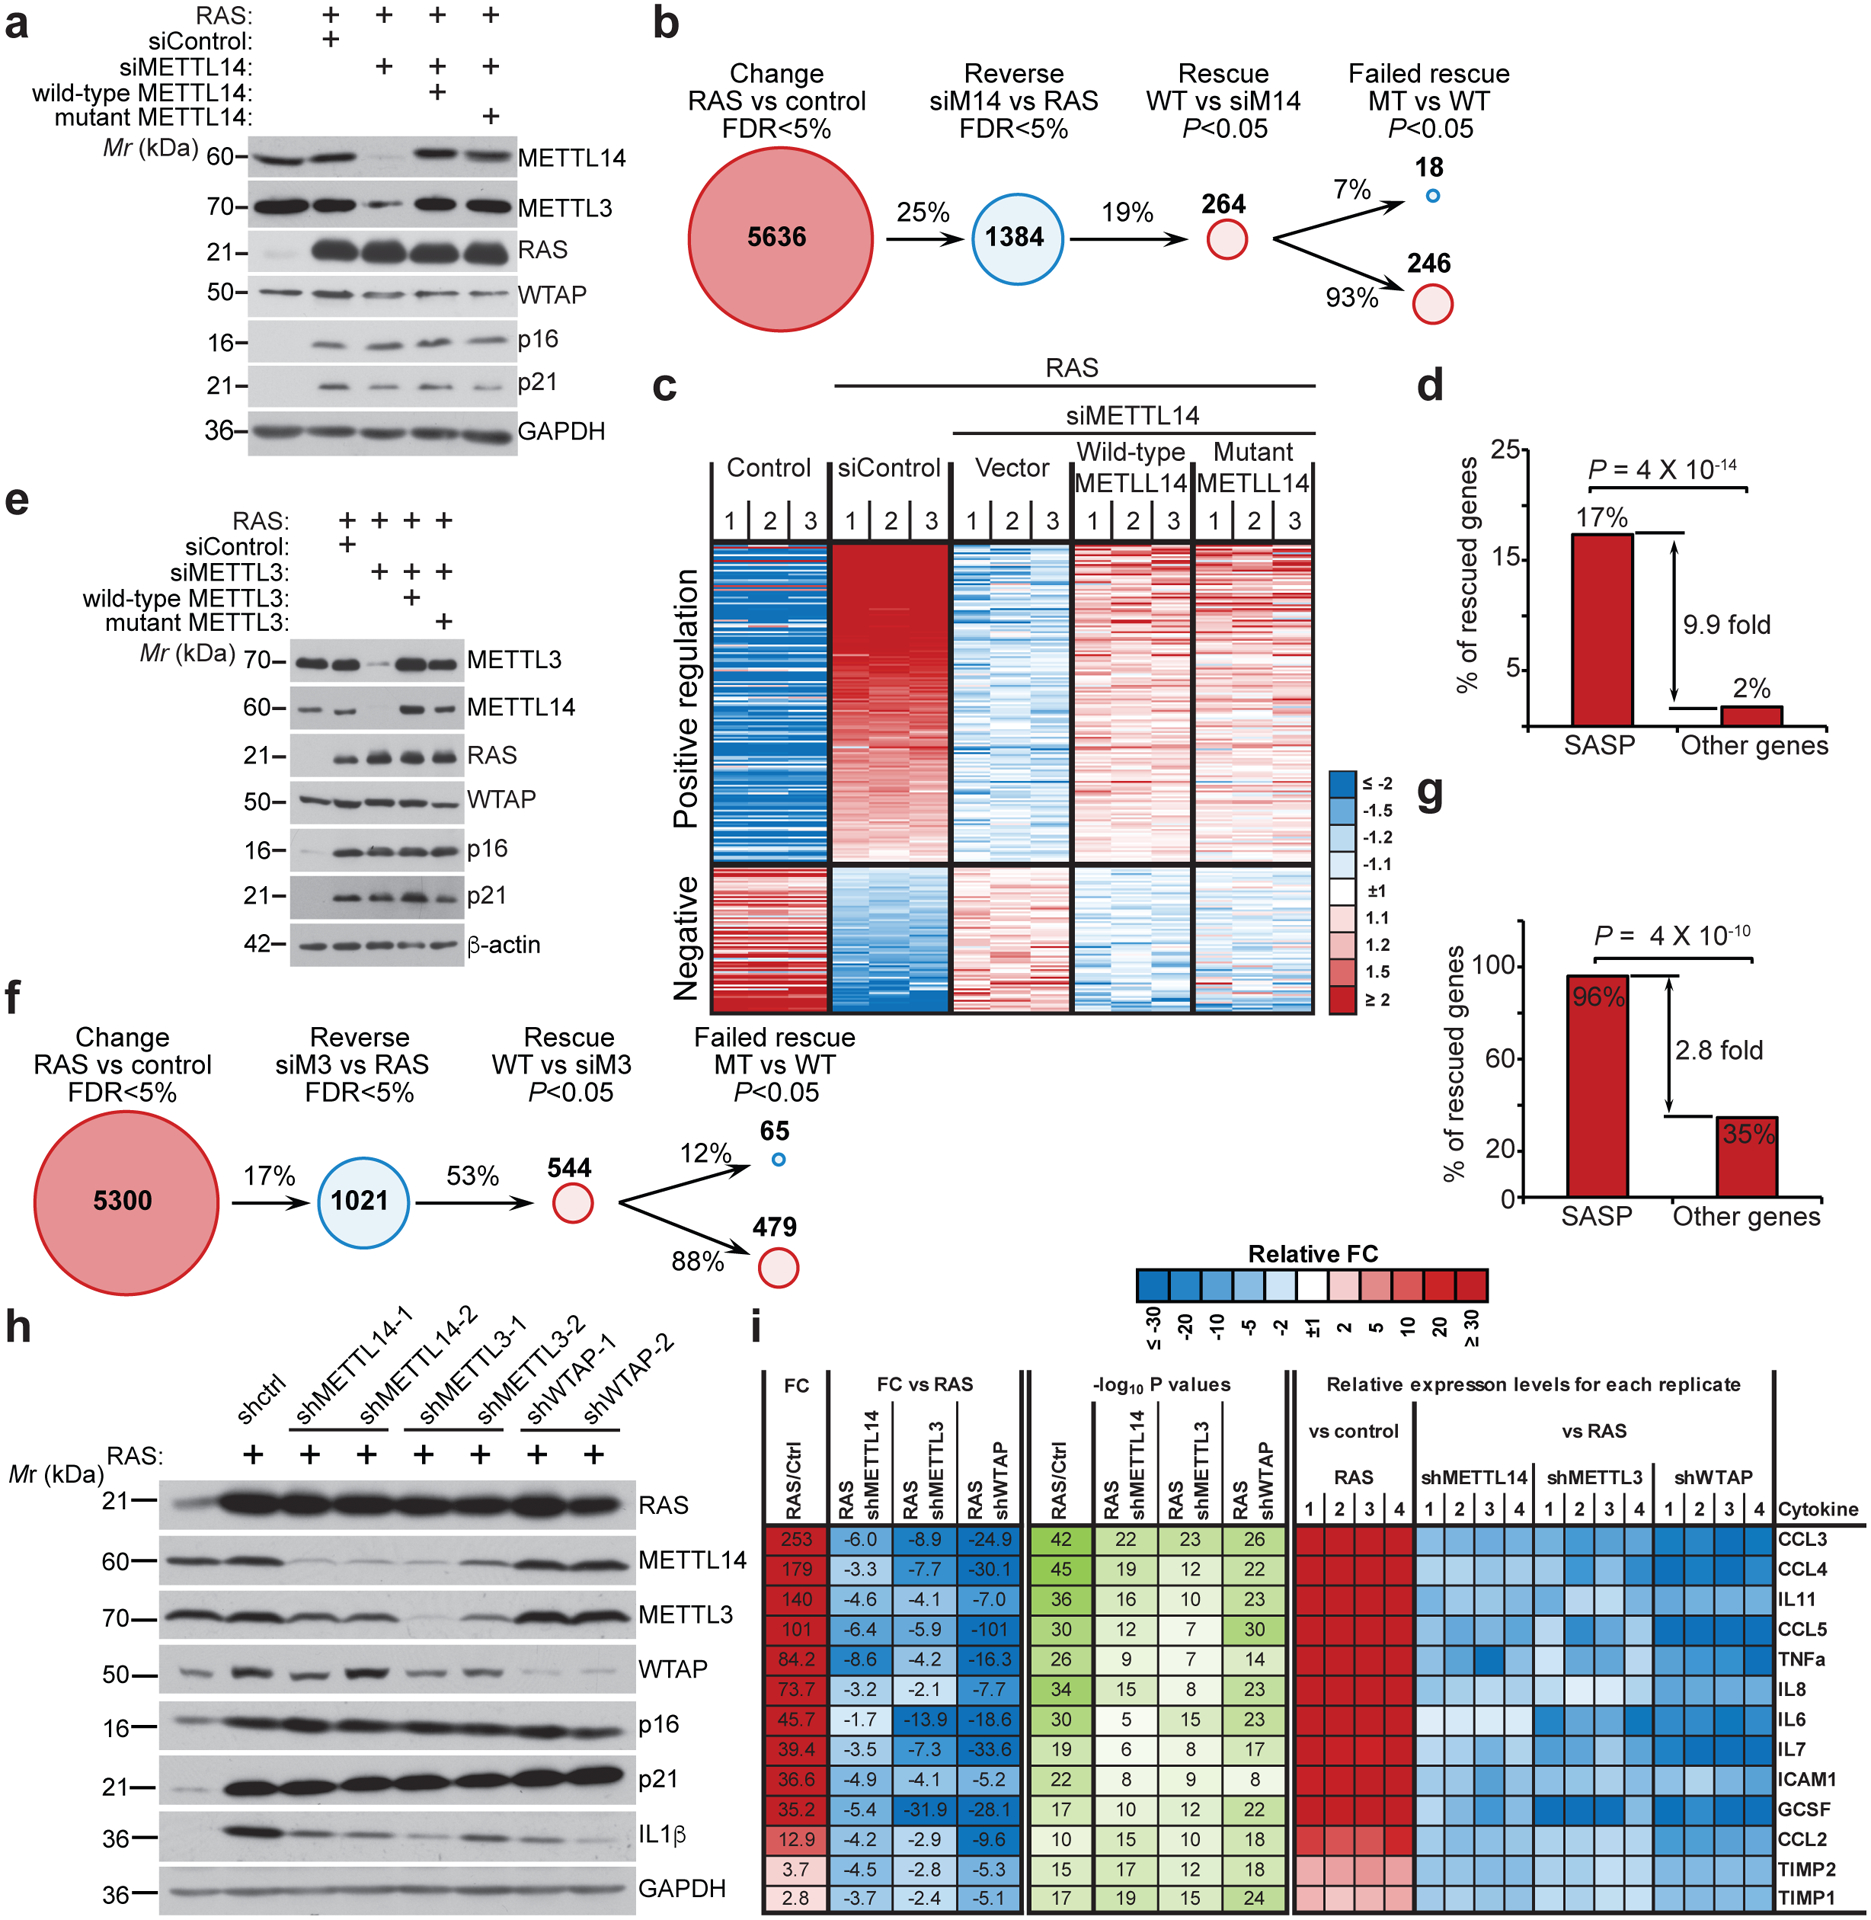
Figure 1: METTL3 and METTL14 regulate SASP.

a, IMR90 cells were induced to senesce by oncogenic RAS expressing a non-targeting siRNA control (siControl) or METTL14-targeted siRNA (siMETTL14) with or without the rescue of ectopically expressed wildtype or the R298P mutant METTL14. Cells were harvested and analyzed for expression of the indicated proteins by immunoblot. The experiment was repeated three times independently with similar results. b-d, Numbers of genes significantly changed in the indicated cells determined by RNA-seq analysis (b), and heatmap of RNA-seq data with 3 biologically independent replicates in each of the groups for the genes whose expression significantly changed by METTL14 knockdown and rescued by both wildtype and the R298P mutant METTL14 (c), among which SASP genes were significantly enriched (d). e-g, IMR90 cells were induced to senesce by oncogenic RAS expressing a non-targeting siRNA control (siControl) or METTL3-targeted siRNA (siMETTL3) with or without the rescue of ectopically expressed wildtype or the D394A/W397A mutant METTL3. Cells were harvested and analyzed for expression of the indicated proteins by immunoblot (e). The experiment was repeated three times independently with similar results. Numbers of genes significantly changed in the indicated cells determined by RNA-seq analysis (f), and SASP genes were significantly enriched among the genes whose expression significantly changed by METTL3 knockdown and rescued by both wildtype and the D394A/W397A mutant METTL3 (g). h, IMR90 cells were induced to senesce by RAS with or without the expression of the indicated shRNAs. Expression of the indicated proteins was determined by immunoblot. The experiment was repeated three times independently with similar results. i, The secretion of soluble factors under the indicated conditions was detected by antibody arrays. The heatmap indicates the fold change (FC) in comparison to the control or RAS-induced senescent condition. Relative expression levels per replicate and average fold change differences are shown (n=4 biologically independent replicates). P values were calculated using a two-tailed Fisher Exact test in 1d and 1g. Uncropped blots for 1a, 1e, 1h, and numerical source data for 1i are provided.
