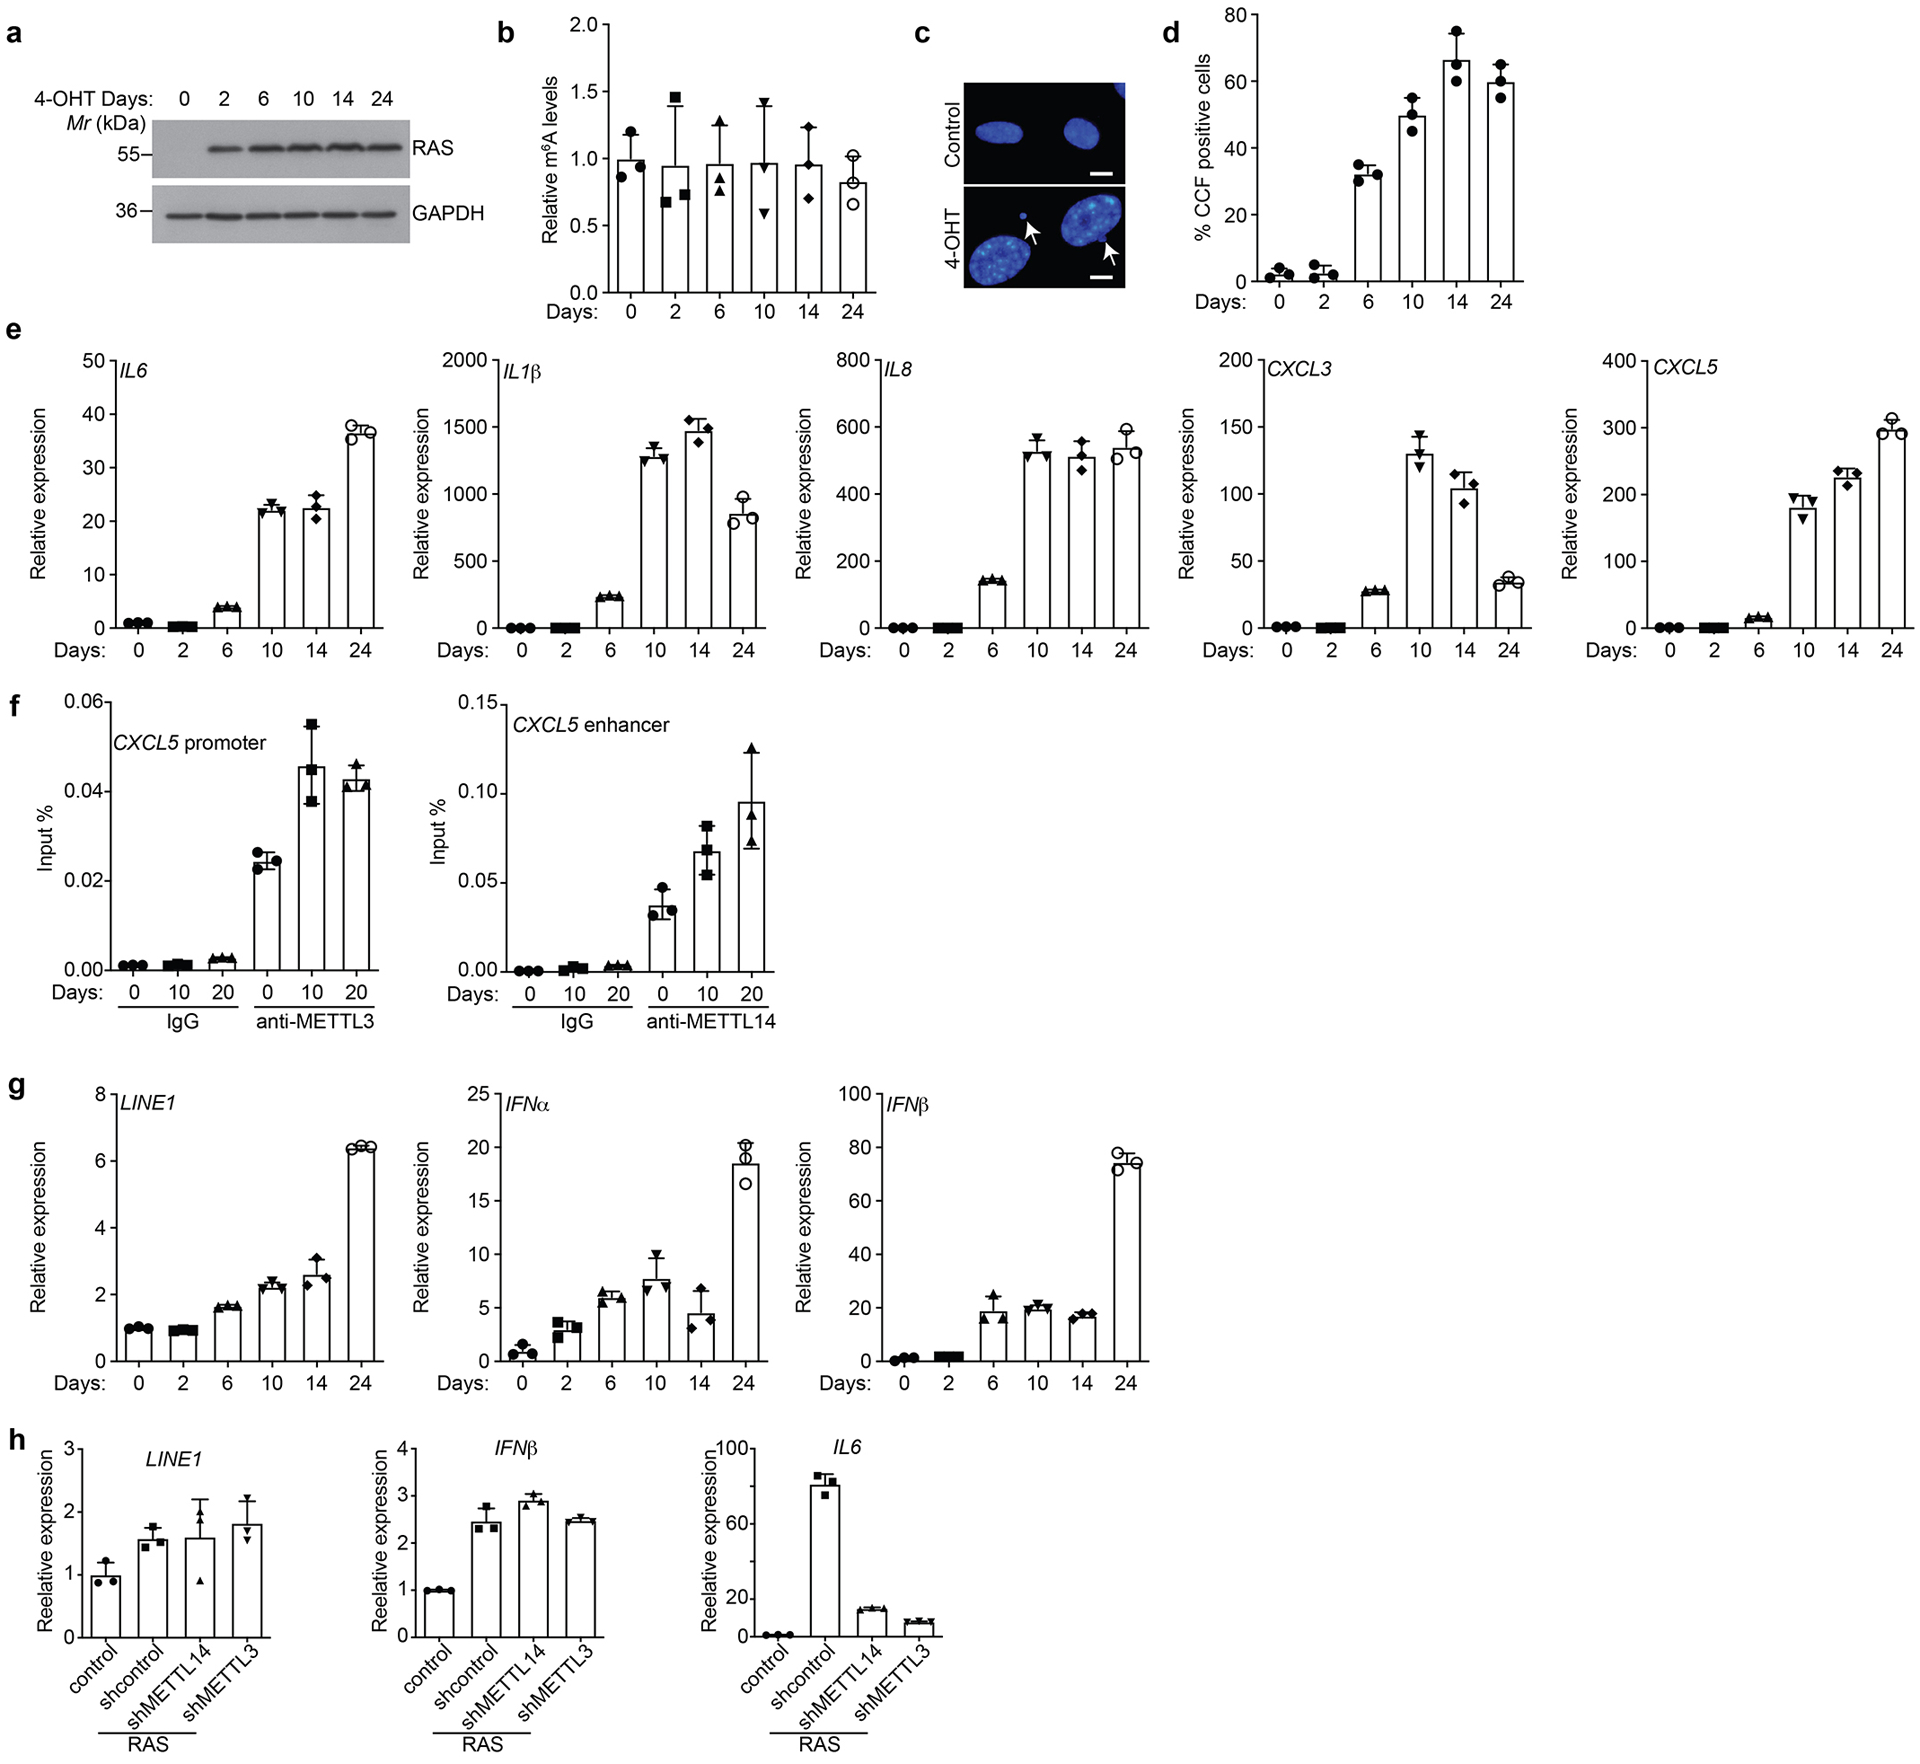
Extended Data Fig. 6. Kinetics of SASP gene expression.

a-g, ER:RAS-expressing IMR90 cells were treated with 100 nM 4-OHT to induce RAS expression and analyzed for RAS expression by immunoblot (a), quantified for m6A levels from total RNAs (b), CCF formation (c) and quantification (d), expression of the indicated SASP genes (e), association of METTL3 and METTL14 with CXCL5 promoter and enhancer (f), or LINE1 and its regulated IFNα and IFNβ (g) by qRT-PCR analysis at the indicated time points. h, Expression of LINE1 and its regulated IFN β was determined by qRT-PCR in control and senescent cells without or with knockdown of METTL3 or METTL14. IL6 mRNA expression was used as a positive control. Arrows point to examples of CCF formed in RAS-induced senescent cells. Scale bar = 5 μm. Data represent mean ± s.d. of three biologically independent experiments. P values were calculated using a two-tailed t-test. Uncropped blots for 6a and numerical source data for 6b, 6d, 6e, 6f, 6g, and 6h are provided.
