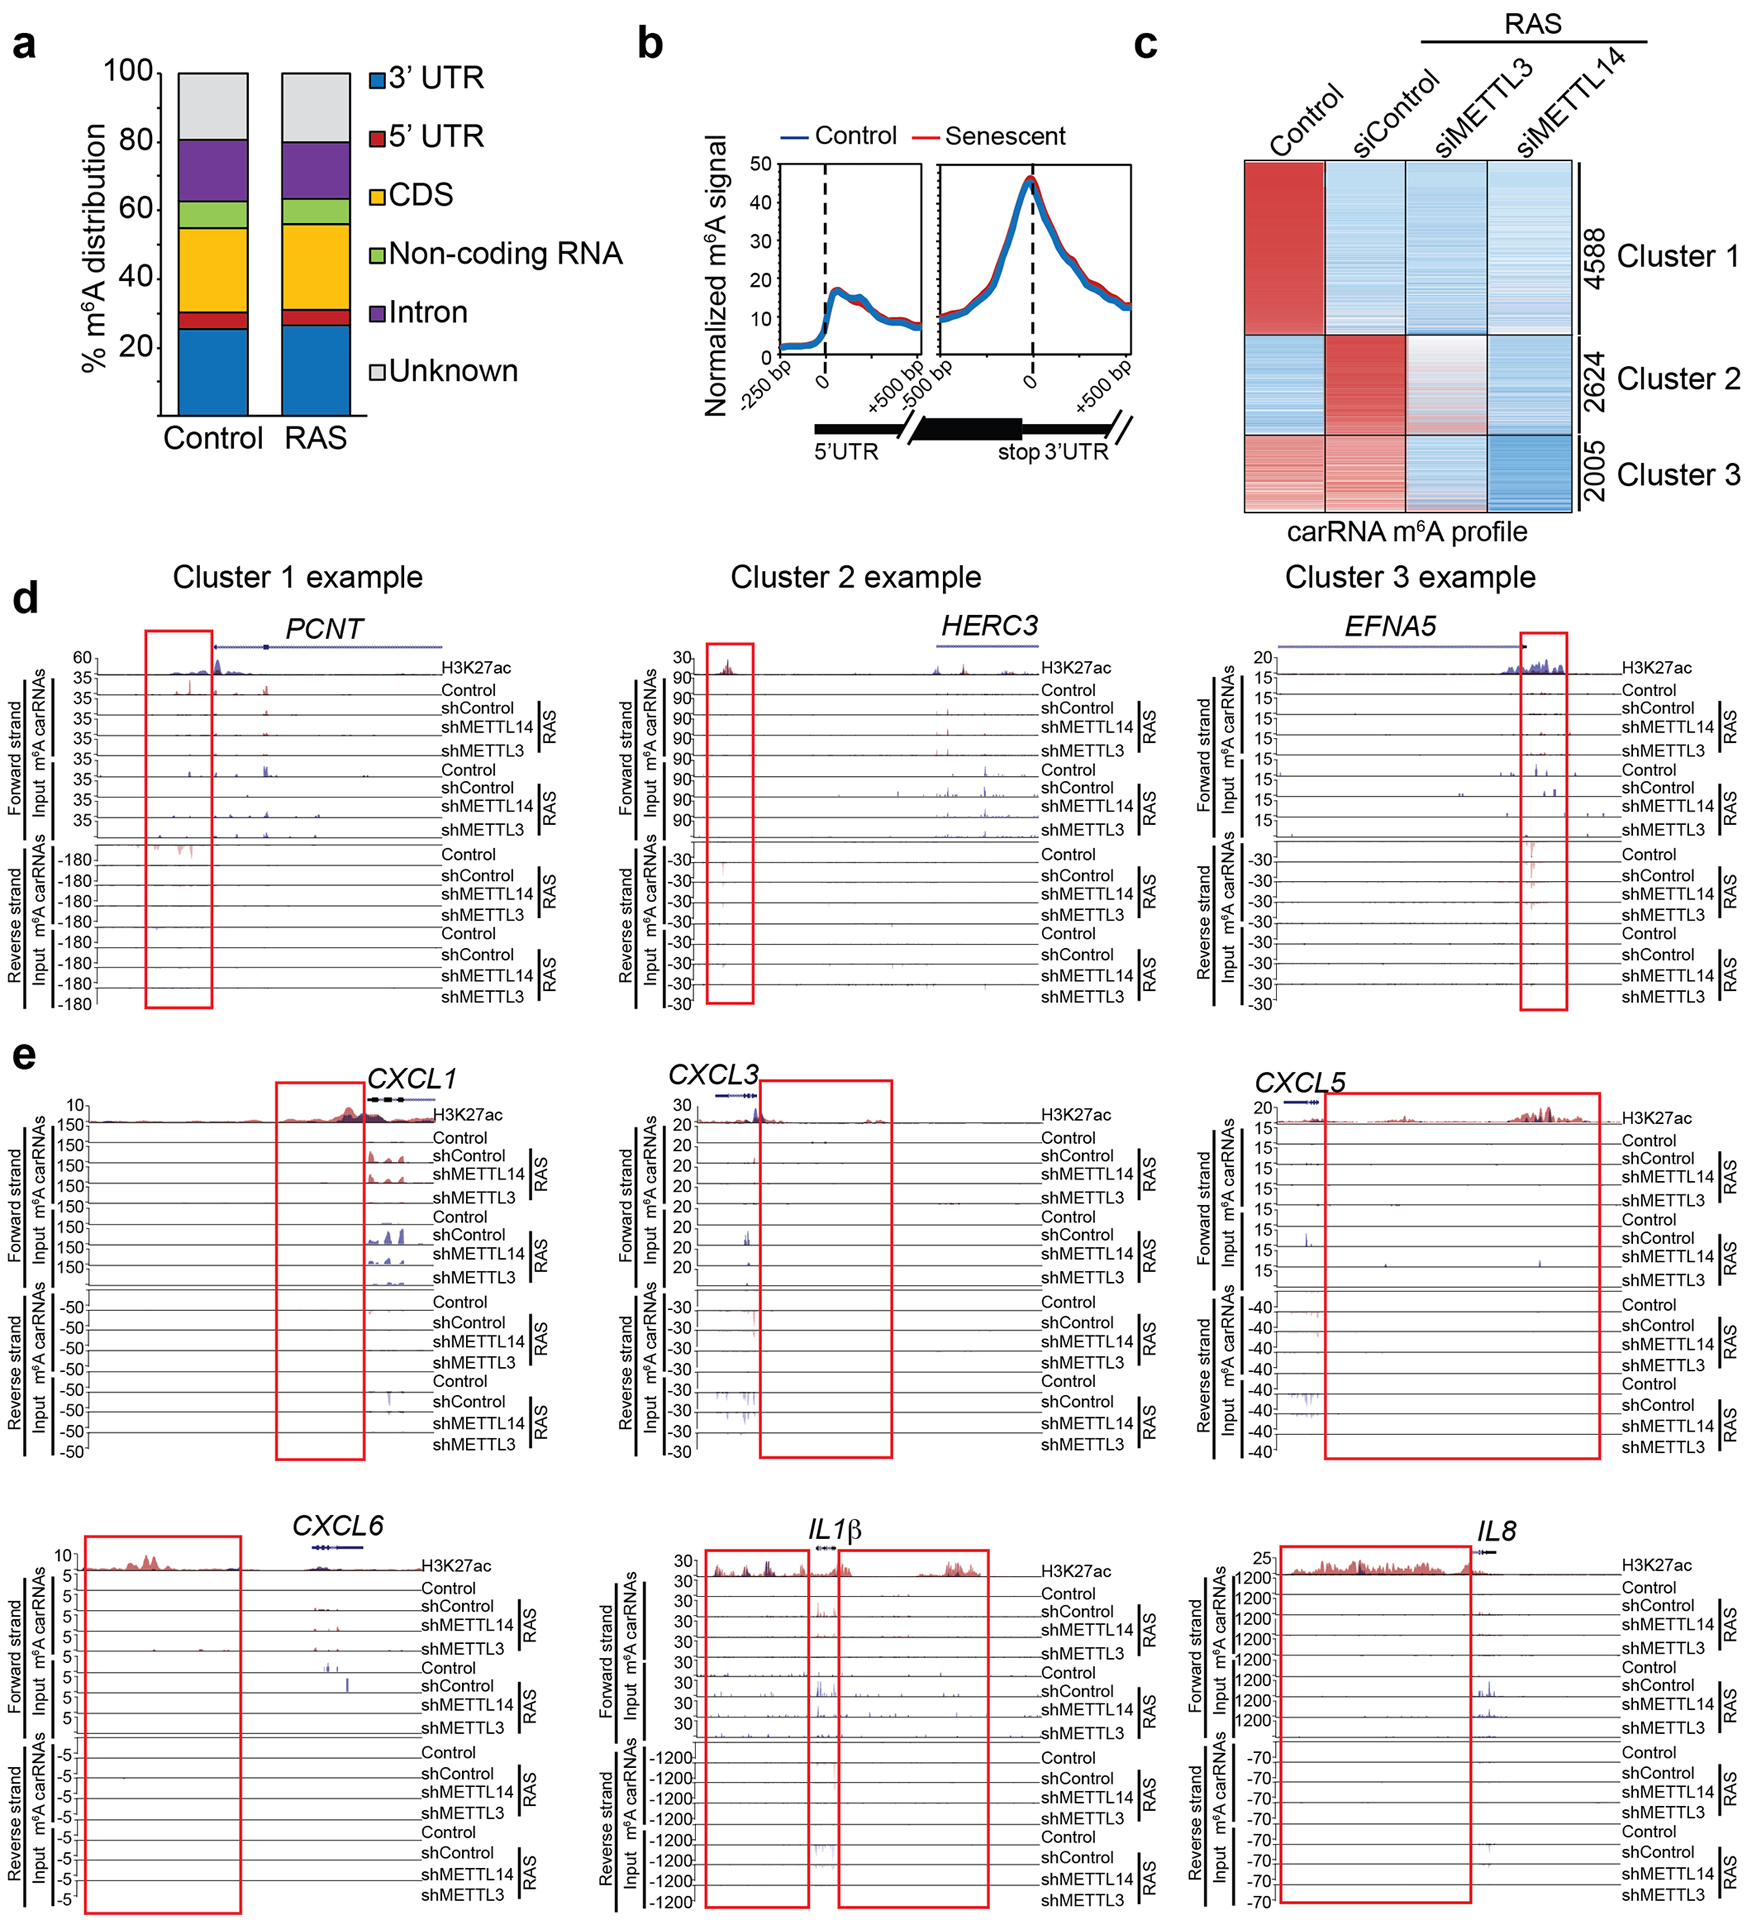
Extended Data Fig. 7. SASP genes are not subjected to m6A modification.

a, Distribution of m6A peaks across the indicated gene structure in control and RAS-induced senescent cells. b, Metagene m6A signal profile illustrating no global changes in m6A modifications around 5’ and 3’ end UTRs between control and RAS-induced senescent cells. c, Heatmap of changes in m6A modification on carRNAs in control and oncogenic RAS-induced senescent cells with or without knockdown of METTL3 or METTL14. d, Examples of m6A tracks at the boxed carRNAs that belong to each of the three indicated clusters with both forward and reverse strands indicated. H3K27ac modification levels in control (in blue) and senescent (in red) cells were used to identify the regulatory chromatin region (enhancer/promoter-associated RNAs). e, m6A tracks at the indicated SASP genes for both forward and reverse strands. Boxes indicated H3K27ac modification levels in control (red) and senescent (blue) cells used to identify the regulatory chromatin region. Please note that the changes in the gene body reflect changes in gene expression and specifically upregulation of SASP genes in senescent cells (and the associated increase in m6A modification was a reflection of an increase in input mRNA expression of these genes).
