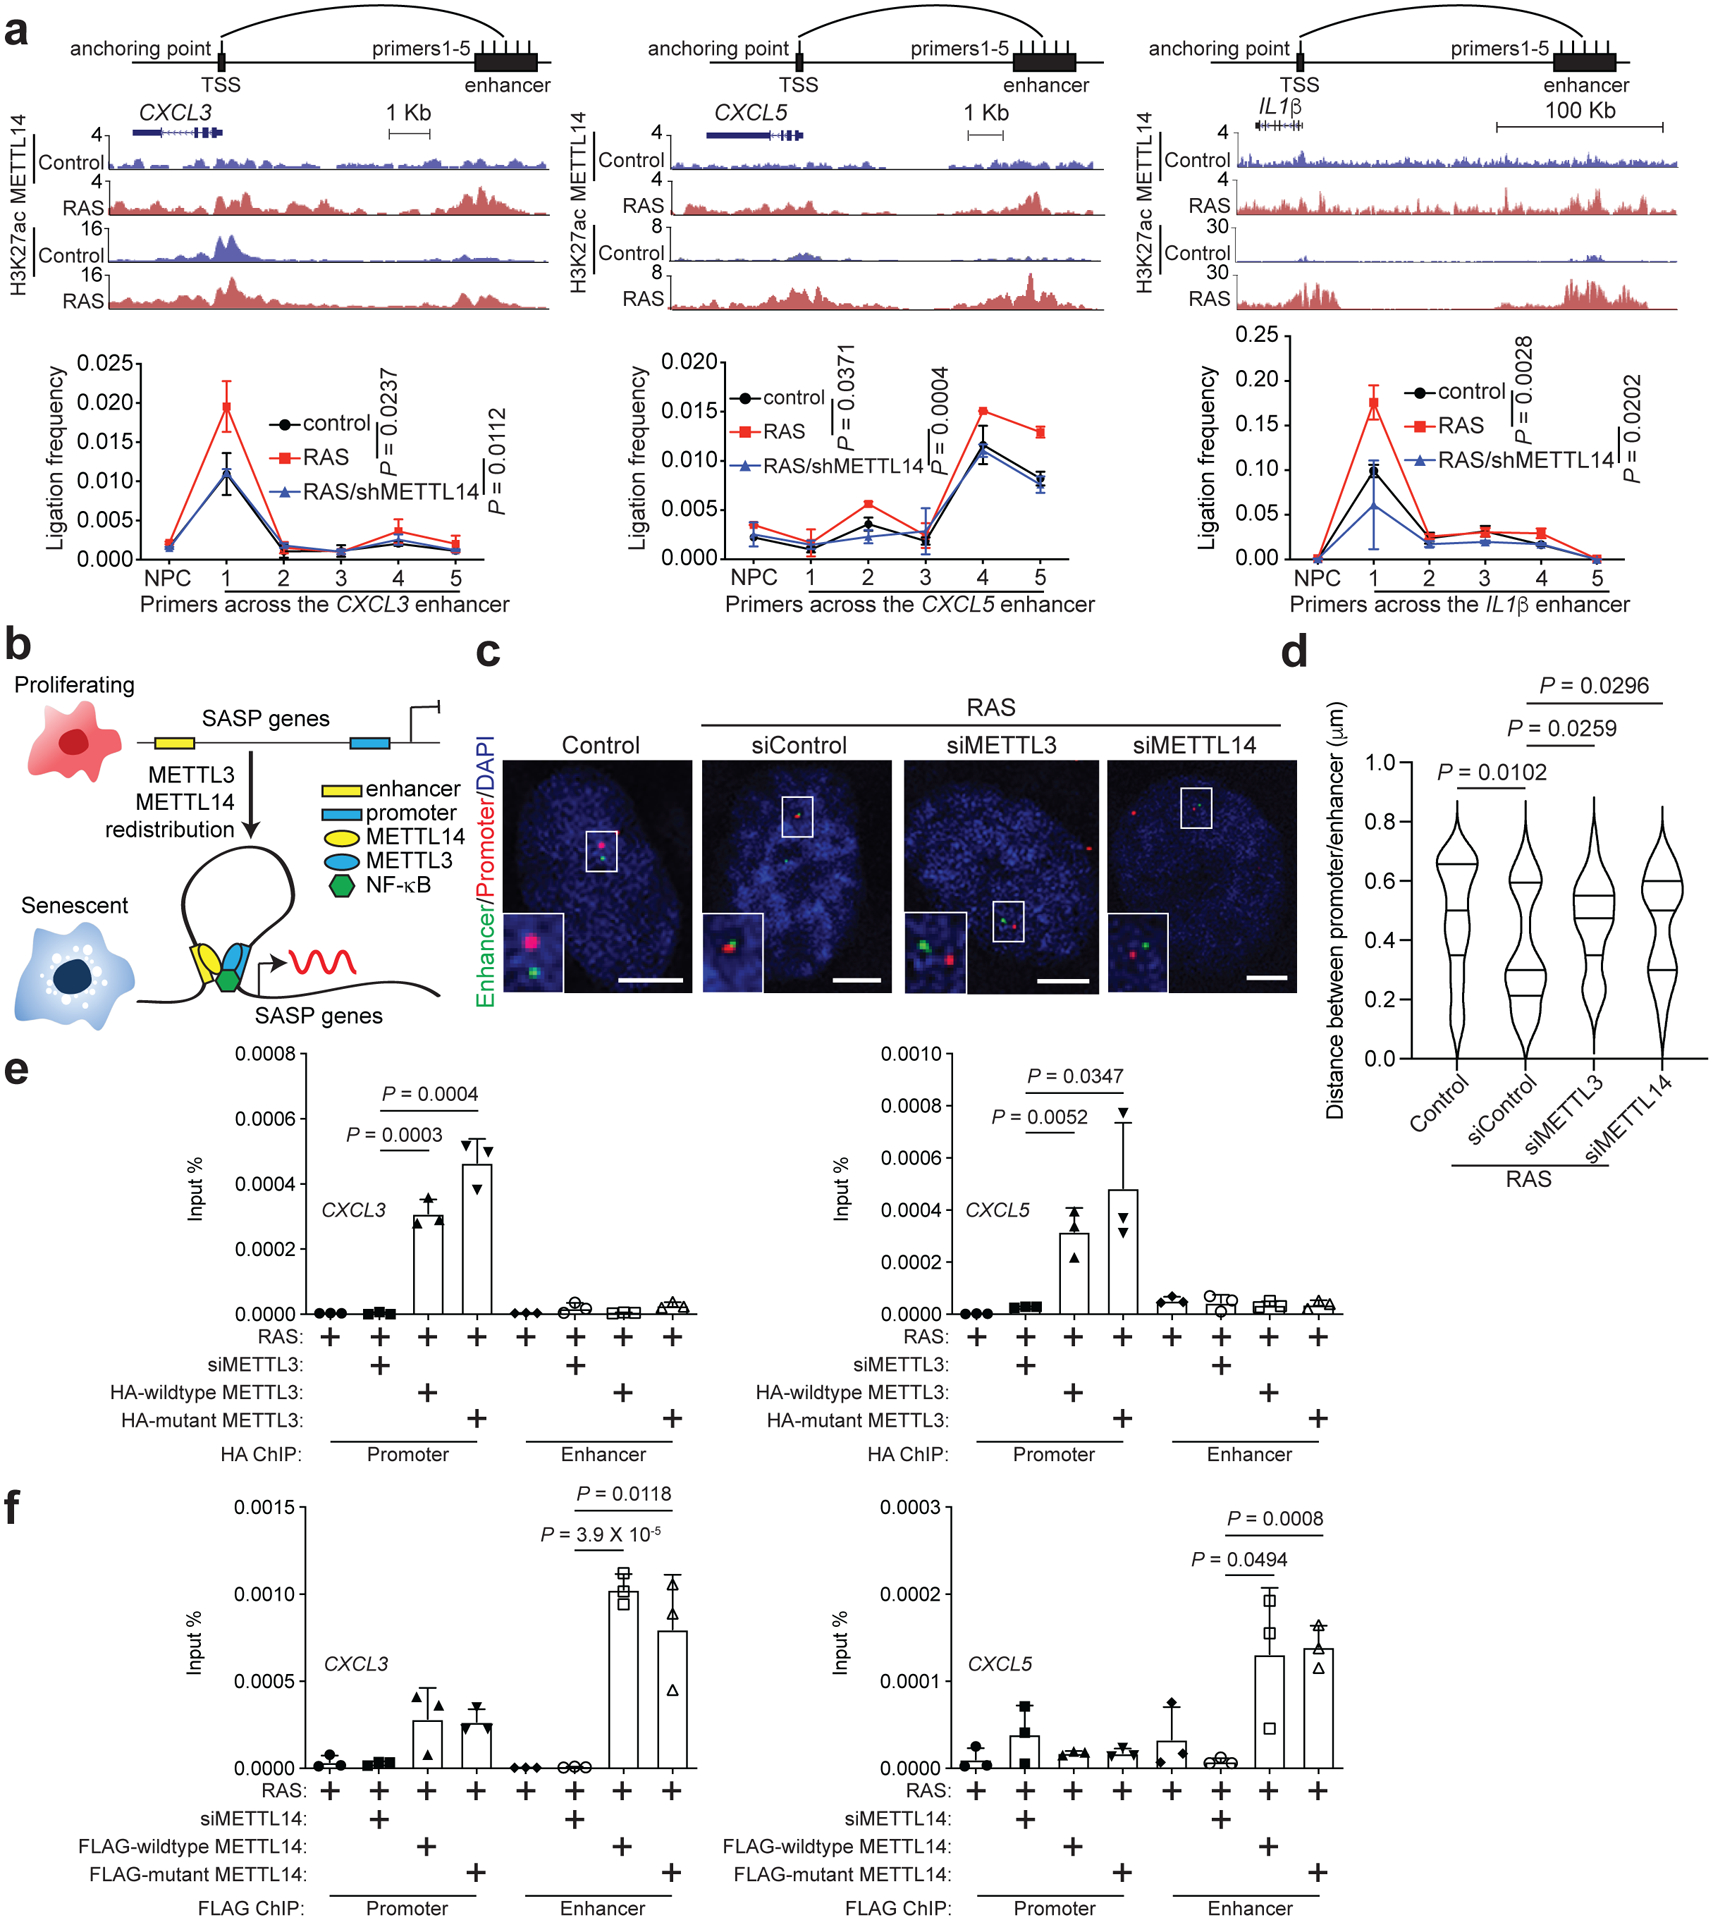
Figure 6: METTL3 and METTL14 mediate SASP gene enhancer and promoter loop formation.

a, 3C-qPCR analysis of the promoter-enhancer interaction frequency on the indicated SASP gene loci in control and RAS-induced senescent cells with or without METTL14 knockdown. Schematic illustrates the 3C primers targeting the enhancer and promoter of the SASP gene loci according to the cut-and-run seq peaks for H3K27ac and METTL14 in control and RAS-induced senescent cells. b, A model for the mechanism by which the redistributed METTL3 and METTL14 promote SASP gene expression in senescent cells by mediating promoter and enhancer looping. c-d, Representative images of 3D DNA-FISH for IL1β locus in control and RAS-induced senescent cells with or without knockdown of METTL3 or METTL14. Dual labelled DNA-FISH was performed with a probe for promoter (in red) and another probe for enhancer (in green) (c). Scale bars = 5 μm. The distance between IL1β promoter and enhancer probes was determined using ImageJ software (d). At least 40 loci were quantified for each of the indicated groups. e-f, ChIP–qPCR analysis of association of HA-tagged wildtype and mutant METTL3 (e) and FLAG-tagged wildtype and mutant METTL14 (f) with the promoters and enhancers of the indicated SASP genes in control and senescent cells with or without endogenous METTL3 or METTL14 knockdown, and rescued with HA-tagged wildtype or mutant METTL3 or FLAG-tagged wildtype or mutant METTL14. Data represent mean ± s.d. of three biologically independent experiments unless otherwise stated. P values were calculated using a two-tailed t-test. Numerical source data for 6a, 6d, 6e and 6f are provided.
