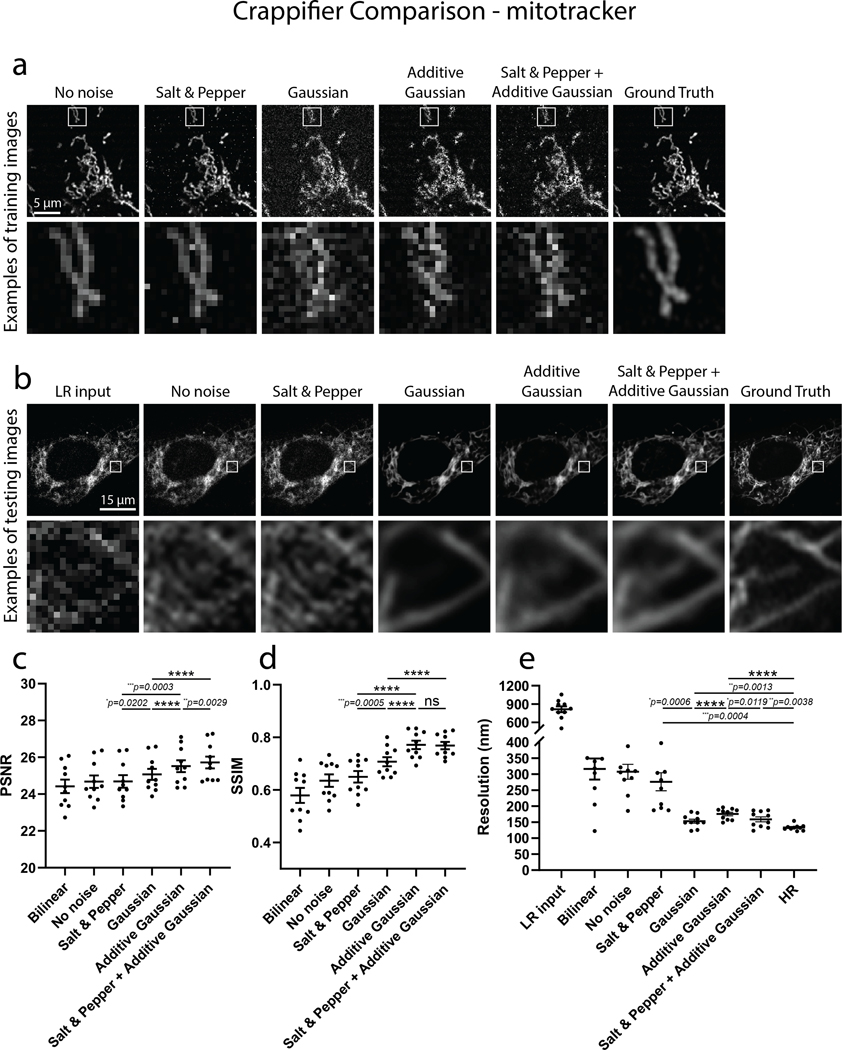
Extended Data Fig. 5. Evaluation of crappifiers with different noise injection on mitotracker data.
Examples of crappified training images, visualized results and metrics (PSNR, SSIM and FRC resolution) of PSSR-SF models that were trained on high- and low-resolution pairs semi-synthetically generated by crappifiers with different noise injection were presented. a, Shown is an example of crappified training images generated by different crappifiers, including “No noise” (no added noise, downsampled pixel size only), Salt & Pepper, Gaussian, Additive Gaussian, and a mixture of Salt & Pepper plus Additive Gaussian noise. High-resolution version of the same region is also included. b, Visualized restoration performance of PSSR models that used different crappifiers (No noise, Salt & Pepper, Gaussian, Additive Gaussian, and a mixture of Salt & Pepper plus Additive Gaussian noise). LR input and Ground Truth of the example testing ROI are also shown. PSNR (c), SSIM (d) and FRC (e) quantification show the PSSR model that used “Salt & Pepper + Additive Gaussian” crappifier yielded the best overall performance (n=10 independent timelapses of fixed samples with n=10 timepoints for all conditions). All values are shown as mean ± SEM. P values are specified in the figure for 0.0001<p<0.05. *p<0.05, **p<0.01, ***p<0.001, ****p<0.0001, ns = not significant; Two-sided paired t-test.

