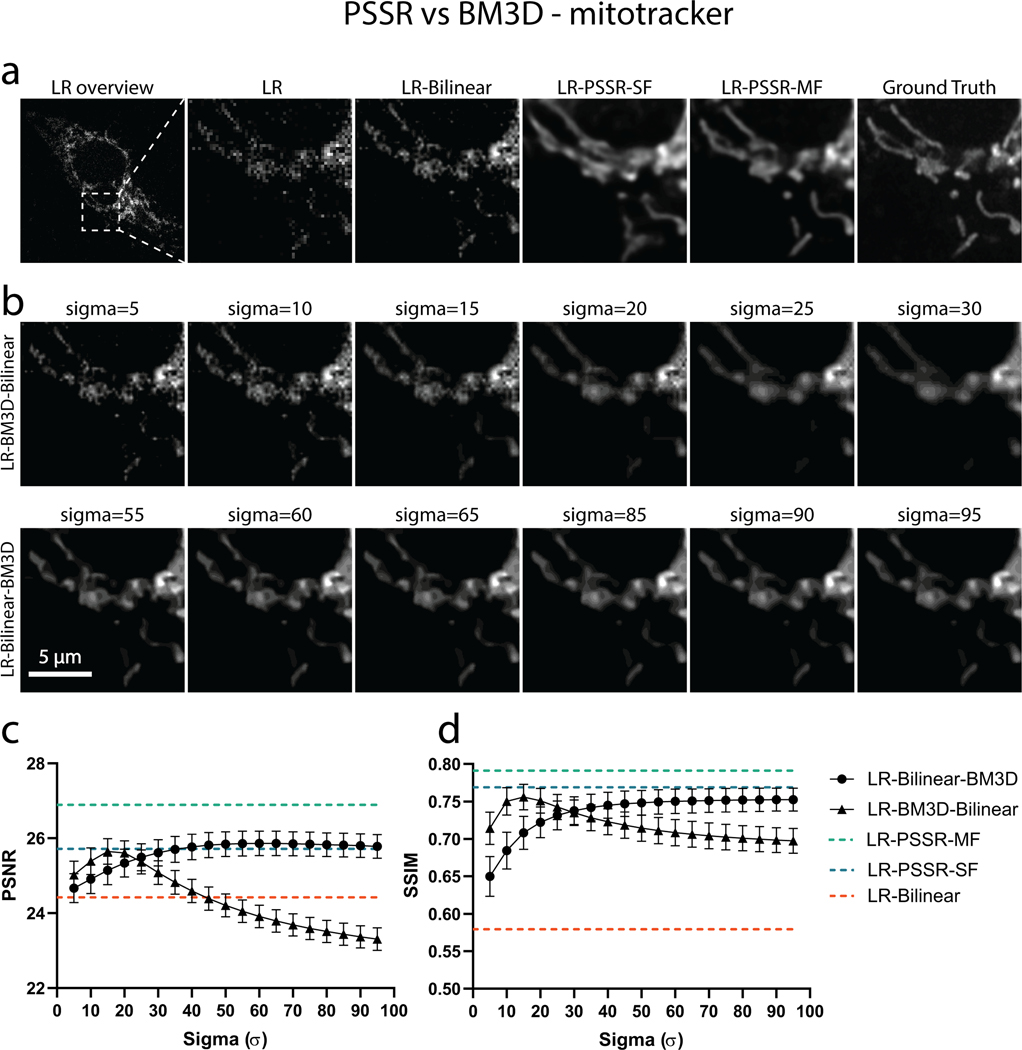
Extended Data Fig. 8. Compare PSSR with BM3D denoising method on mitotracker data.
PSSR restored images was compared to results of applying BM3D denoising algorithm to low-resolution real-world mitotracker images before (LR-BM3D-Bilinear) and after (LR-Bilinear-BM3D) bilinear upsampling. A wide range of Sigma (, with step size of 5) was thoroughly explored. Examples of the same region from the LR input, bilinear upsampled, PSSR-SF restored, PSSR-MF restored, and Ground truth are displayed (a, top row). Images from the top 6 results (evaluated by both PSNR and SSIM values) of LR-BM3D-Bilinear (a, middle row) and LR-Bilinear-BM3D (a, bottom row) are shown. PSNR and SSIM results of LR-BM3D-Bilinear and LR-Bilinear-BM3D across the explored range of sigma are plotted in (b) and (c). Metrics resulted from bilinearly upsampled, PSSR-SF restored and PSSR-MF restored images of the same testing set are shown as dash lines in orange (LR-Bilinear: PSNR=24.42±0.367; SSIM=0.579 ±0. 0287), blue (LR-PSSR-SF: PSNR=25.72±0.323; SSIM=0.769 ±0.0139) and green (LR-PSSR-MF: PSNR=26.89 ±0.322; SSIM=0.791±0.0133). As it shows, in this fluorescence mitotracker example, BM3D performs better than bilinear upsampling with carefully defined noise distribution, whereas its general performance given both PSNR and SSIM is overall worse than single-frame PSSR (LR-PSSR-SF). Excitably, our multi-frame PSSR (LR-PSSR-MF) yields the best performance. n=10 independent timelapses of fixed samples with n=6–10 timepoints each for all conditions. Values are shown as mean ± SEM.

