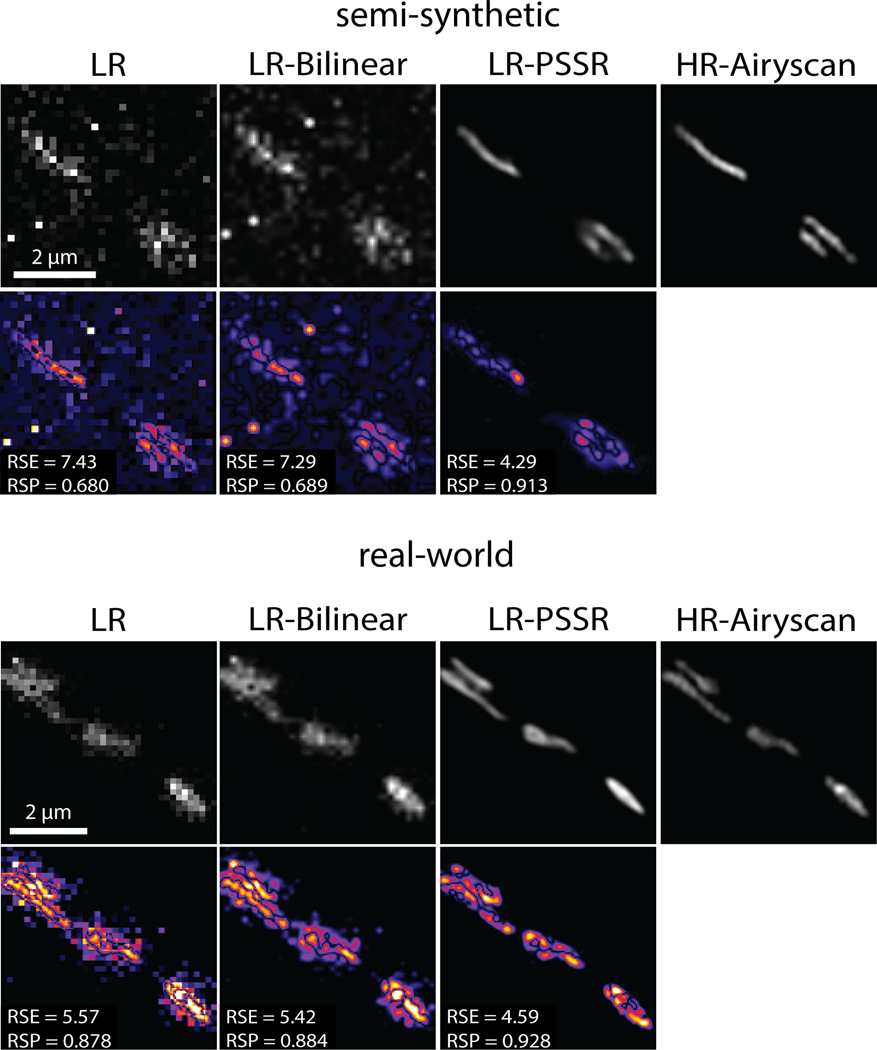
Extended Data Fig. 9. NanoJ-SQUIRREL error-maps of neuronal mitochondria data.
NanoJ-SQUIRREL was used to calculate the resolution scaled error (RSE) and resolution scaled Pearson’s coefficient (RSP) for both semi-synthetic and real-world acquired low (LR), bilinear interpolated (LR-Bilinear), and PSSR (LR-PSSR) images versus ground truth high-resolution (HR) images. For these representative images from Fig. 5, the RSE and RSP images are shown along with the difference images for each output.

