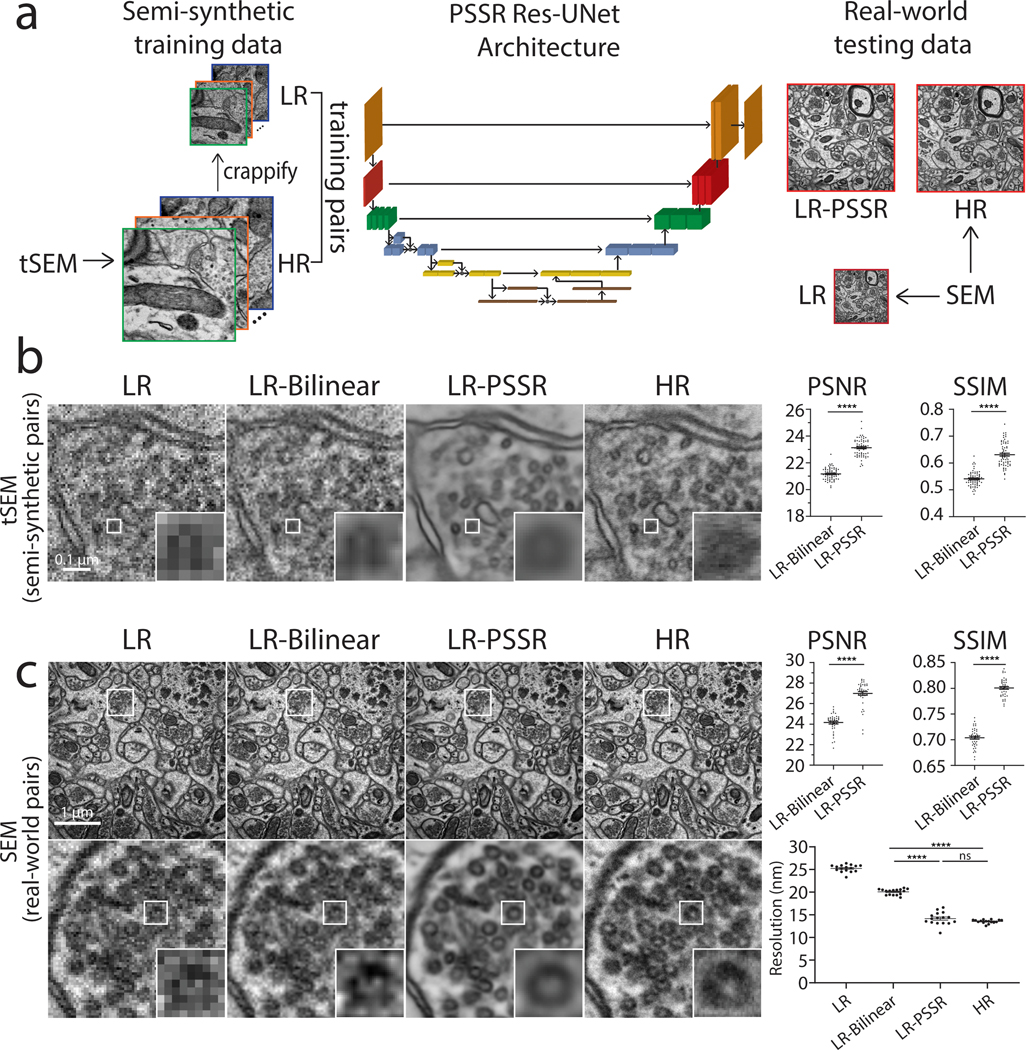
Fig. 2 |. Restoration of semi-synthetic and real-world EM testing data using PSSR model trained on semi-synthetically generated training pairs.

a, Overview of the general workflow. Training pairs were semi-synthetically created by applying a degrading function to the HR images taken from a scanning electron microscope in transmission mode (tSEM) to generate LR counterparts (left column). Semi-synthetic pairs were used as training data through a dynamic ResNet-based U-Net architecture. Layers of the same xy size are in the same color (middle column). Real-world LR and HR image pairs were both manually acquired under a SEM (right column). The output from PSSR (LR-PSSR) when LR is served as input is then compared to HR to evaluate the performance of our trained model. b, Restoration performance on semi-synthetic testing pairs from tSEM. Shown is the same field of view of a representative bouton region from the synthetically created LR input with the pixel size of 8nm (left column), a 16x bilinear upsampled image with 2nm pixel size (second column), 16x PSSR upsampled result with 2nm pixel size (third column) and the HR ground truth acquired at the microscope with the pixel size of 2nm (fourth column). A close view of the same vesicle in each image is highlighted. The Peak-Signal-to-Noise-Ratio (PSNR) and the Structural Similarity (SSIM) quantification of the semi-synthetic testing sets are shown (right) (n = 66 independent images). c, Restoration results of manually acquired SEM testing pairs. Shown is the comparison of the LR input acquired at the microscope with a pixel size of 8nm (left column), 16x bilinear upsampled image (second column), 16x PSSR upsampled output (third column) and the HR ground truth acquired at the microscope with a pixel size of 2nm (fourth column). Bottom row compares the enlarged region of a presynaptic bouton with one vesicle highlighted in the inset. Graphs comparing PSNR, SSIM and image resolution are also displayed (right). The PSNR and SSIM values were calculated between an upsampled result and its corresponding HR ground truth (n = 42 independent images). Resolution was calculated with the Fourier Ring Correlation (FRC) plugin in NanoJ-SQUIRREL by acquiring two independent images at low and high-resolution (n = 16 independent images). All values are shown as mean ± SEM. P values are specified in the figure for 0.0001<p<0.05. *p<0.05, **p<0.01, ***p<0.001, ****p<0.0001, ns = not significant; Two-sided paired t-test.
