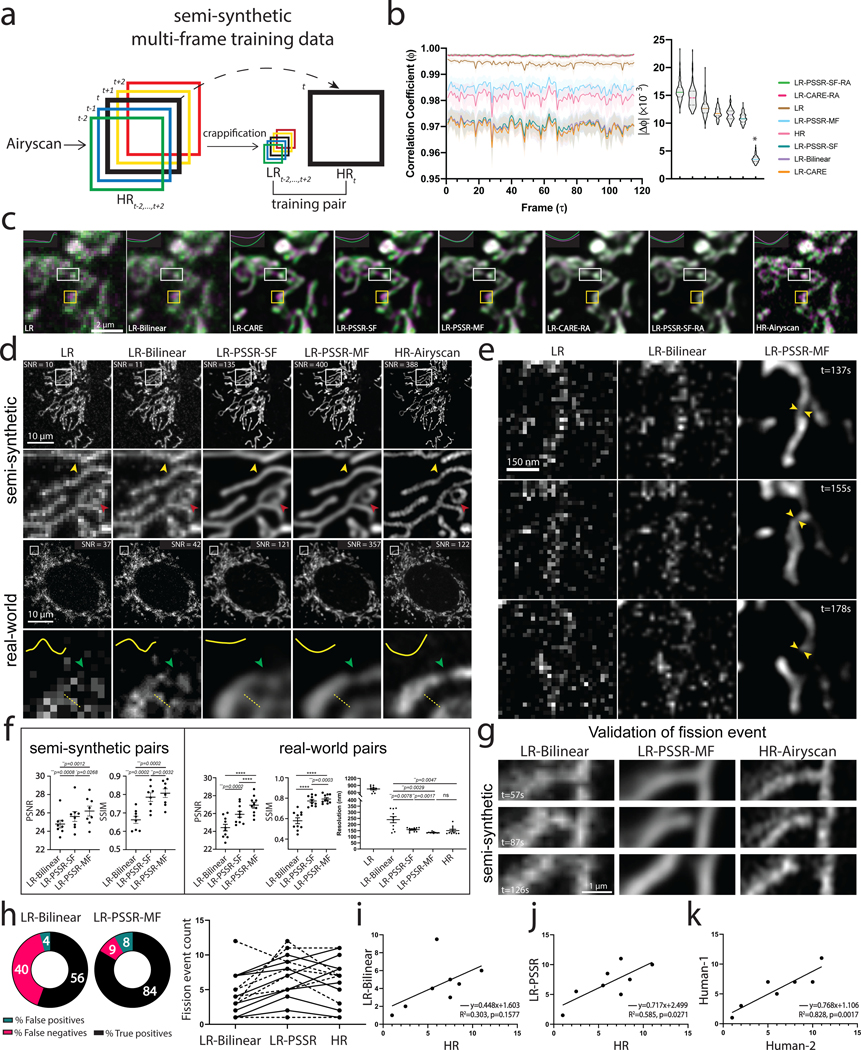
Fig. 4 |. Multi-frame PSSR timelapses of mitochondrial dynamics.
a, Overview of multi-frame PSSR training data generation method. Five consecutive frames () from a HR Airyscan time-lapse movie were synthetically crappified to five LR images (), which together with the HR middle frame at time , form a five-to-one training “pair”. b, Temporal consistency analysis. Neighboring-frame cross-correlation coefficient ( that corresponds to frame in -axis denotes the correlation coefficient of frame ) and frame (Left). Absolute error against HR () for each condition was compared (, right). n = 6 independent timelapses with n = 80–120 timepoints each. Colored shades show standard error. The * sign above LR-PSSR-MF denotes that LR-PSSR-MF is significantly more consistent with HR than all other conditions (P<0.0001). All violin plots show lines at the median and quartiles. c, Examples of false mitochondrial network merges (white boxes) due to the severe flickering artifacts in single-frame models (LR-Bilinear, LR-CARE and LR-PSSR-SF), and loss of temporal consistency and resolution (yellow boxes) in models post-processed with a “rolling frame averaging” method (LR-CARE-RA and LR-PSSR-SF-RA). Two consecutive frames of an example region from semi-synthetic acquired low-resolution (LR), bilinearly upsampled (LR-Bilinear), CARE (LR-CARE), 5-frame Rolling Average post-processed CARE output (LR-CARE-RA), single-frame PSSR (LR-PSSR-SF), single-frame PSSR post-processed with a 5-frame Rolling Average (LR-PSSR-RA), 5-frame multi-frame PSSR (LR-PSSR-MF), and ground truth high-resolution (HR-Airyscan) time-lapses are color coded in magenta () and green (). Insets show the intensity line plot of the two frames drawn in the center of the white box in each condition. The yellow box shows an example of temporal resolution loss in RA conditions (LR-CARE-RA and LR-PSSR-SF-RA) only. Magenta pixels represent signal that only exists in the t=0s frame, but not in the t=5s, while green pixels represent signal present only in the t=5s frame. d, Restoration performance on semi-synthetic and real-world testing pairs. For the semi-synthetic pair, LR was synthetically generated from Airyscan HR movies. Enlarged ROIs show an example of well resolved mitochondrial structures by PSSR, agreeing with Airyscan ground truth images. Red and yellow arrowheads show two false connecting points in LR-Bilinear and LR-PSSR-SF, which were well separated in LR-PSSR-MF. In the real-world example, green arrowheads in the enlarged ROIs highlight a well restored gap between two mitochondria segments in the LR-PSSR-MF output. Normalized line-plot cross-section profile (yellow) highlights false bridging between two neighboring structures in LR-Bilinear and LR-PSSR-SF, which was well separated with our PSSR-MF model. Signal-to-Noise Ratio (SNR) measured using the images in both semi-synthetic and real-world examples are indicated. e, PSSR output captured a transient mitochondrial fission event. Shown is a PSSR-restored dynamic mitochondrial fission event, with three key time frames displayed. Arrows highlight the mitochondrial fission site. f, PSNR and SSIM quantification of the semi-synthetic (n = 8 independent timelapses with n = 80–120 timepoints each) as well as the real-world (n = 10 independent timelapses of fixed samples with n=10 timepoints each) testing sets discussed in (d). FRC values measured using two independent low- versus high- resolution acquisitions from multiple cells are indicated (n = 10). g, Validation of fission event captures using semi-synthetic data. An example of a fission event that was detectable in LR-PSSR but not LR-Bilinear. Experiments were repeated with 8 timelapses, achieving similar results. h, For fission event detection, the number of false positives, false negatives, and true positives detected by expert humans was quantified for 8 different timelapses. Distribution was shown in the pie charts. Fission event counts from two humans were plotted (Dashed line: Human-1, solid line: Human-2). i-k, Linear regression between LR-Bilinear and HR, LR-PSSR and HR, and two human counters of HR are shown (n = 8 independent timelapses with n = 80–120 timepoints each). The linear regression equation, the Goodness-of-Fit (R2) and the p-value of each graph are displayed. All values are shown as mean ± SEM. P values are specified in the figure for 0.0001<p<0.05. *p<0.05, **p<0.01, ***p<0.001, ****p<0.0001, ns = not significant; Two-sided paired t-test.

