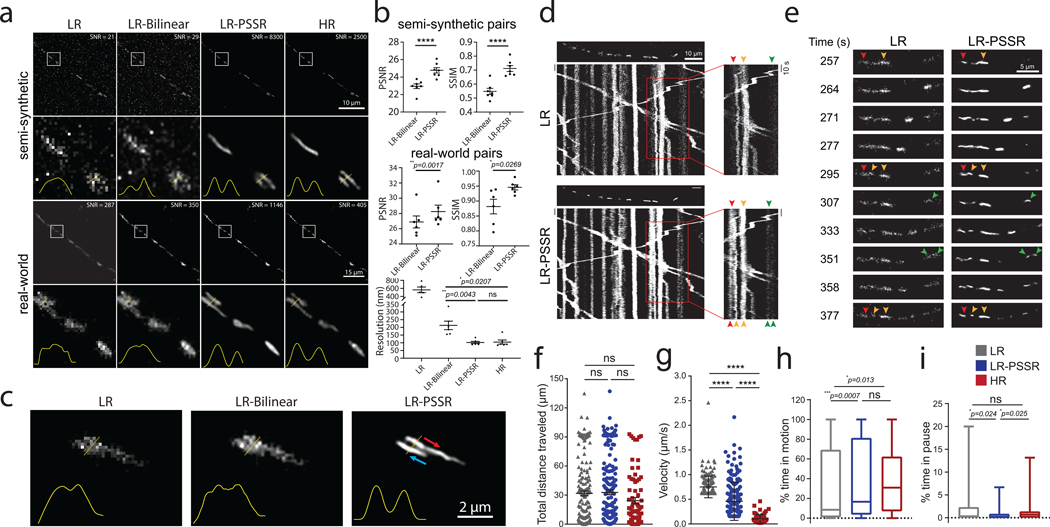
Fig. 5 |. Spatiotemporal analysis of mitochondrial motility in neurons.
PSSR facilitates high spatiotemporal resolution imaging of mitochondrial motility in neurons. a, Comparison of PSSR results (LR-PSSR) versus bilinear interpolation (LR-Bilinear) on semi-synthetic (n = 7 independent timelapse movies with n=100 independent time points each) and real-world testing pairs (n = 6 independent timelapse movies with n=12 independent time points each). Enlarged ROIs from representative images show PSSR resolved two mitochondria in both semi-synthetic and real-world testing sets, quantified by normalized line plot cross-section profiles. SNR b, PSNR (top) and SSIM (middle) quantification of the datasets in (a). FRC resolution measured from two independent acquisitions of the real-world overview dataset discussed in (a) is indicated (bottom). c, PSSR restoration of LR timelapses resolves mitochondria moving past one another in a neuronal process (arrows indicate direction of movement). d, Representative kymographs of mitochondrial motility in hippocampal neurons transfected with Mito-DsRed (n = 7 independent LR timelapse movies processed to LR-PSSR). First frame of each time-lapse movie is shown above each kymograph. Different color arrowheads indicate mitochondria going through fission and fusion events. Each color represents a different mitochondrion. e, Enlarged areas of (d), capturing mitochondrial fission and fusion events in real-time. f-i, Mitochondrial motility was quantified from time-lapse movies as demonstrated in Supplementary Video 8. For each mitochondrial trajectory the total distance mitochondria travelled (f), mitochondrial velocity (g), percent time mitochondria spent in motion (h) and in pause (i) was quantified (n = 76 – 216 mitochondria from 4 neurons and 3 independent experiments). All values are shown as mean ± SEM. P values are specified in the figure for 0.0001<p<0.05. *p<0.05, **p<0.01, ***p<0.001, ****p<0.0001, ns = not significant; Two-sided paired t-test (b) and Kruskal-Wallis test followed by Dunn’s multiple comparison test (f-i).

