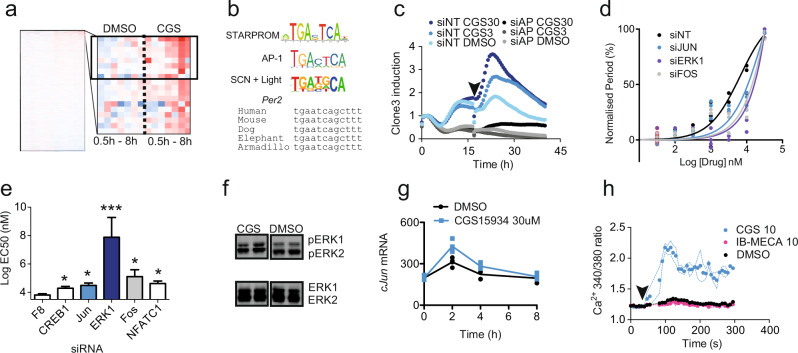
Fig. 2. STAR_PROM identifies ERK-AP1 pathway downstream of adenosine signalling.
a Time course of RNA-seq reads for barcoded luciferase from BC-STARPROM reporter transfected U2OS cells treated with DMSO control or 30 μM CGS (n = 2, timeline – 0, 0.5, 1, 2, 4 and 8 h after treatment). The enlarged cluster shows the top 20 upregulated clones, of which 8 were statistically significant (boxed, p < 0.05, two-way ANOVA). b Consensus sequence from the upregulated clones with the consensus AP-1 RE and the light-regulated SCN transcriptome motif shown for comparison. The conservation of the AP-1 RE in the PER2 gene is indicated, genomic position 2:238287740 (hg38) in humans and 1:91458384 (mm9) in mice. c Reporter activity of clone3 after knockdown of FOS and JUN (siAP1 – grey) when compared with a non-targeting siRNA control (siNT – blue) in response to CGS (30 μM – C30, 3 μM – C3 or DMSO, n = 4, single trace shown for clarity). d, e Concentration response curves and EC50 of CGS-mediated period lengthening in Per2-Luc U2OS cells after knockdown of the genes indicated (n = 4, DMSO controls outlined in red * = p < 0.05, *** = p < 0.001 One-way ANOVA, Bonferroni post-hoc test); EC50 error calculated from raw data in (n). f Increased phosphorylation of ERK1/2 (pT202/Y204 – pERK) with 30 μM CGS treatment in U2OS cells (48% ± 18% increase, p = 0.03, n = 3 to 6, one-way ANOVA, Tukey’s post-hoc test). g cJUN mRNA increases after treatment with 30 μM CGS – C30 (n = 4, ** = p < 0.0021 at 2 h, Šídák’s multiple comparisons test). h Ca2+ release in response to 10 µM CGS administered at arrow, measured by Fura2 reporter. IB-MECA caused no change. Dashed lines indicate range of data. Individual data points overlaid on all charts with line representing mean, unless otherwise indicated, error bars = S.E.M.

