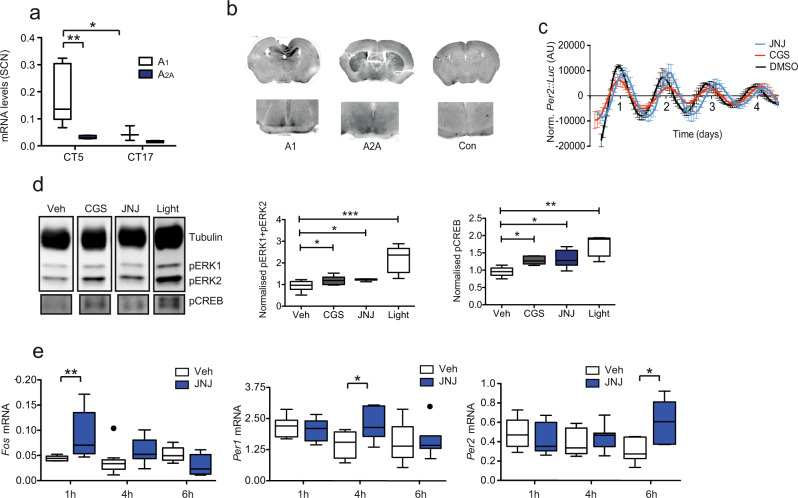
Fig. 3. The SCN expresses adenosine receptors and responds to adenosine receptor antagonists.
a Expression of adenosine receptor (Adora) subtypes within the mouse SCN at two different circadian times (n = 5, A1 at a higher concentration compared to A2A p = 0.0138, and at higher levels at CT5 (0.178 ± 0.04) compared to CT17 (0.073 ± 0.03) p = 0.0223, two-way ANOVA with Bonferroni post-hoc test). b Immunohistochemistry for A2A and A1 receptor subtypes showing expression within the SCN (inset). c SCN slice cultures from Per2::Luc mice treated with the A2A/A1 antagonists CGS15943 (CGS) 10 μM (red, period length 25.1 ± 0.1 h, n = 3) and JNJ40255392 (JNJ) 10 μM (blue, period length 26.24 ± 0.3 h; n = 5; DMSO 23.1 h ± 0.3 h n = 5; p = 0.0000076439 for CGS and 0.0484 for JNJ, Tukey’s multiple comparisons test. d Western blot with antibodies against pERK1/2 (pT202/Y204 - pERK) and pCREB (pS133) within the SCN collected from mice 45 min after i.p. injection of CGS or JNJ at 5 mg/kg at CT6, SCN collected from mice exposed to a 30 min CT16 light pulse included for comparison (n = 7 from two experiments of n = 3 and n = 4, uncut blots shown in Supplementary material, one-way ANOVA with Bonferroni post-hoc test). Box plots show relative expression. e Increases in Fos, Per1, and Per2 mRNA within the SCN after i.p. injection of JNJ at CT6 after 1, 4 and 6 h respectively, n = 6–10. p = 0.0387 for Fos, 1 h; p = 0.0183 for Per1, 4 h and p = 0.0322 for Per2, 6 h, one-way ANOVA with Bonferroni post-hoc test. Tukey’s box plots used throughout (central line – mean, box represents 25th to 75th percentile data, whiskers are 1.5 interquartile range).

