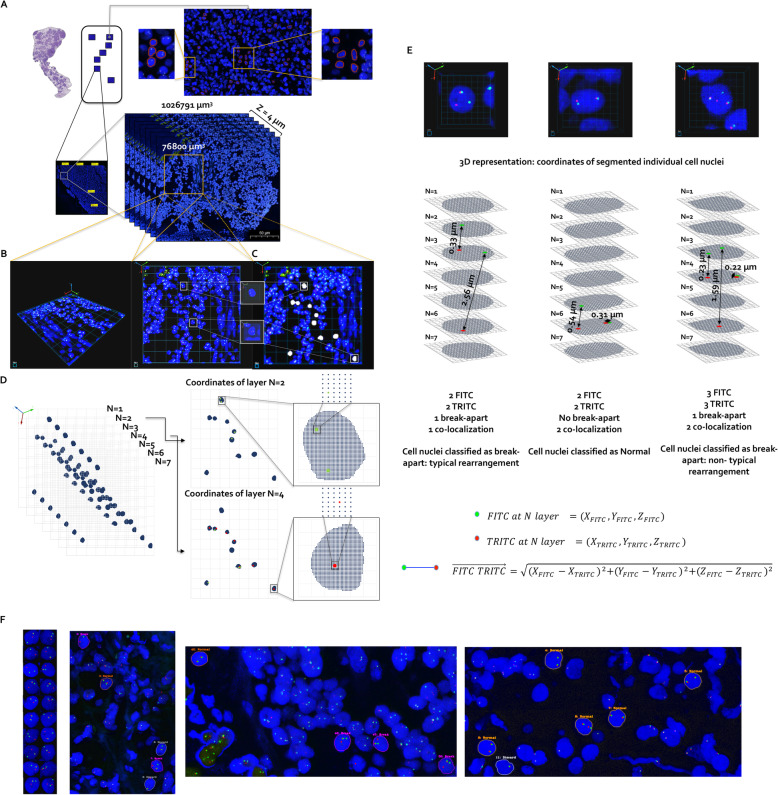
Fig. 3.
Segmentation and coordinates representation of signals to determine 3D co-localization, break-apart and other variations in individual cell nuclei patterns. a Volume and segmentation representation. Showing Z-stack images scanned with 7-layer and 0.6 μm interval at the same area. Blue is DAPI channel for stained nuclei, green is FITC channel, and red is TRITC channel. b 3D representation of selected volume from panel A. c Segmentation of clear individual cell nuclei (shown in gray) found at the volume. d Coordinates representation of segmented signals from the 7-layers Z-stack. e 3D vector length calculation using the X, Y and Z coordinates extracted from the 7-layers Z-stack (to determine co-localization and break-apart between FITC and TRITC signals) and classification of cell nuclei pattern. f Collection of segmented individual cell nuclei to show variations in signals patterns (normal in orange frame, break in purple frame and other patterns in gray frame)

