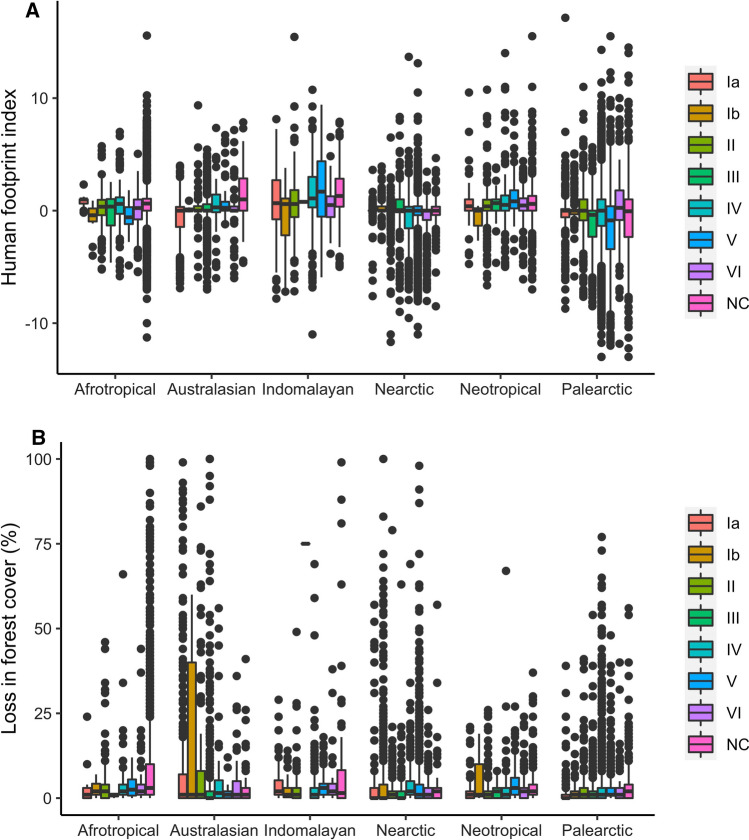
Fig. 2.
Change in human footprint (a) and loss in forest cover (b) within each IUCN category and each realm based on the raw data prior to weighting or matching. A positive value indicates an increase in human pressure, while a negative value indicates a decrease. NC = protected areas with no IUCN category. Outliers represent values smaller than Q1–1.5 × IQR or larger than Q3 + 1.5 × IQR, where Q1 and Q3 are the first and the third quartiles, and IQR is the interquartile range (i.e., Q3 − Q1)

