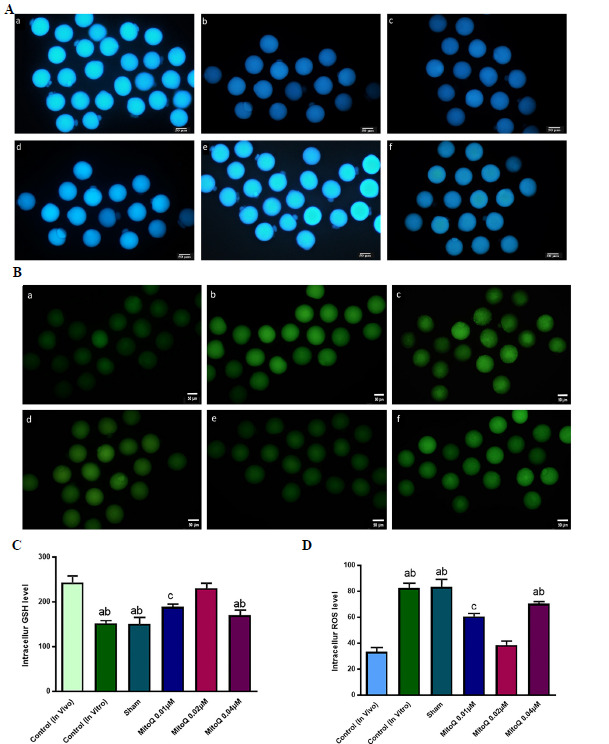
Figure 1.

Representative images of all experimental groups to detect intracellular ROS (Stained with D H2DCFDA) as green fluorescence (A) and GSH (Stained with Cell Tracker Blue) as blue fluorescent (B). All images captured in 20X magnification. In the 0.01 and 0.02 µM MitoQ supplemented groups, compared with other IVM groups, the level of ROS significantly decreased and on the other side, the GSH level had a significant increase. Although there were a lower intracellular ROS and a higher intracellular GSH level in the in vivo-control group compared to 0.02 µM. Scale bar = 50 µm a, in vivo-control, ba, in vitro-control, c, sham, d. 0.01 µM MitoQ, e. 0.02 µM MitoQ and f, 0.04 µM MitoQ. C and D are the quantification data of acquired fluorescence images and representing the ROS and GSH levels and each column in these graphs indicates the significant difference between the control, sham and treated groups (Mean ± SEM). a, versus in vivo- control and 0.02 µM MitoQ (p <0.01); b, versus 0.01 µM MitoQ (p <0.05); c, versus in vivo-control and 0.02 µM MitoQ (p <0.05).
