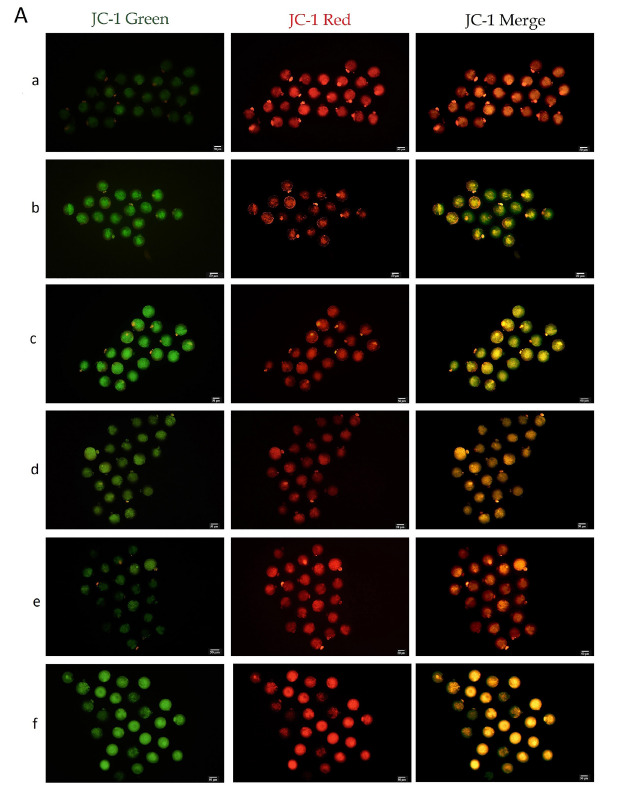
Figure 2.

JC-1 Representative images of all experimental groups, all images captured in 20X magnification. ΔΨm was significantly increased in the 0.02 µM MitoQ and in vivo-control groups compared to other IVM groups (p<0.001). Scale bar = 20 µm, a, in vivo-control, b, in vitro-control, c, sham, d. 0.01µM MitoQ, e. 0.02 µM MitoQ and f, 0.04 µM MitoQ.
