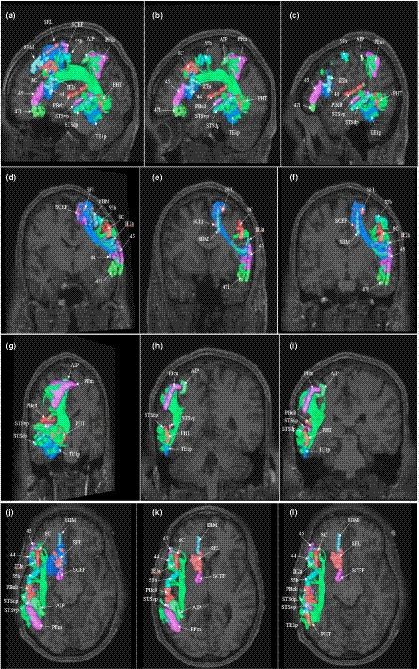
FIGURE 4.

Fiber tracking analysis for the semantic network. Shown on T1‐weighted MR images in the left cerebral hemisphere. TOP ROW: sagittal sections from most medial to most lateral demonstrating the superior longitudinal fasciculus and its projections between the frontal, parietal, and temporal clusters of the dorsal attention network. ROW TWO AND THREE: Partially oblique (left column) and pure (middle and right column) coronal sections. BOTTOM ROW: axial sections through the frontal and parietal clusters of the network. The fronto‐parietal projections of the SLF are particularly apparent
