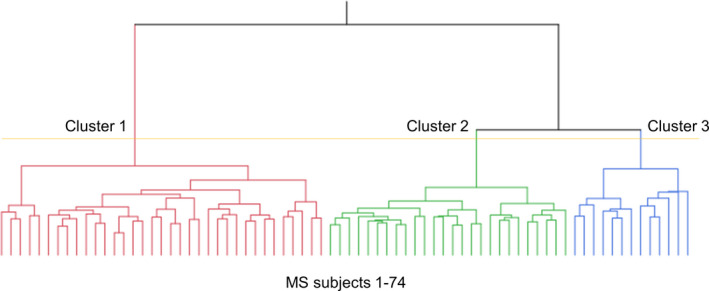
FIGURE 1.

Dendrogram of multiple sclerosis (MS) patients clustered according to cortical thickness data. The distance along the y‐axis represents the similarity among the clusters: A shorter distance indicates a greater degree of similarity. The horizontal axis represents the 74 MS patients included in the cluster analysis. At the 3‐cluster level (yellow line), MS patients were clustered into three subgroups: Cluster 1 (C1), Cluster 2 (C2), and Cluster 3 (C3)
