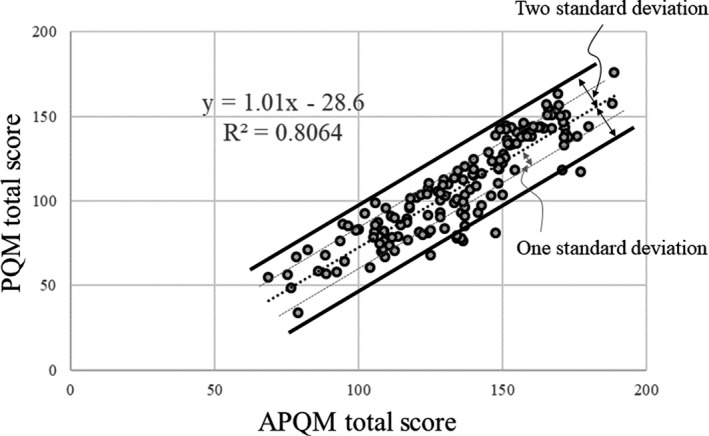
Fig. 2.

Correlation between the APQM total score and PQM total score of 148 patients underwent prostate IMRT and VMAT at our institution from 2012 to 2019. The black dotted line indicates a linear approximation. The solid black line shows two standard deviations from the linear approximation, and the dotted gray line shows one standard deviation from the linear approximation. APQM: adjusted plan quality metric, PQM: plan quality metric.
