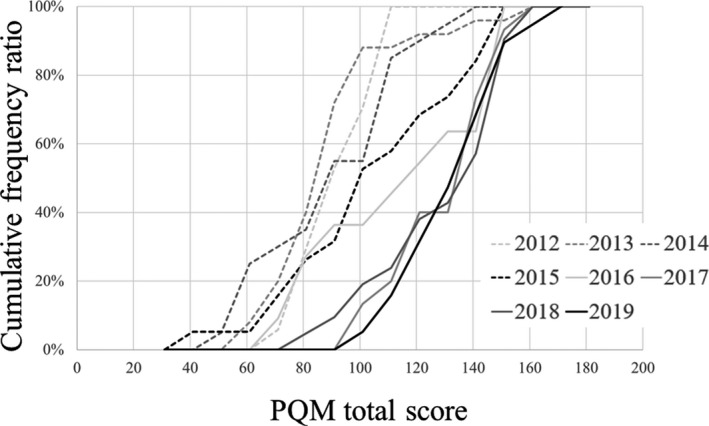
Fig. 3.

Cumulative frequency ratios by PQM total score for the treatment plans were adopted by the clinical plans for each year from 2012 to 2019. The cumulative frequency distribution indicates the cumulative percentage of PQM scores for each year's treatment plan. For example, a cumulative frequency distribution of 0% indicates the treatment plan with the lowest PQM total score of the treatment plan for that year; a cumulative frequency distribution of 50% indicates the treatment plan with the median PQM total score of the treatment plan for that year; and a cumulative frequency distribution of 100% indicates the treatment plan with the highest PQM total score of the treatment plan for that year. Therefore, the cumulative frequency distribution shows that the right side of the graph indicates that the quality of the treatment plan is better. PQM: plan quality metric.
