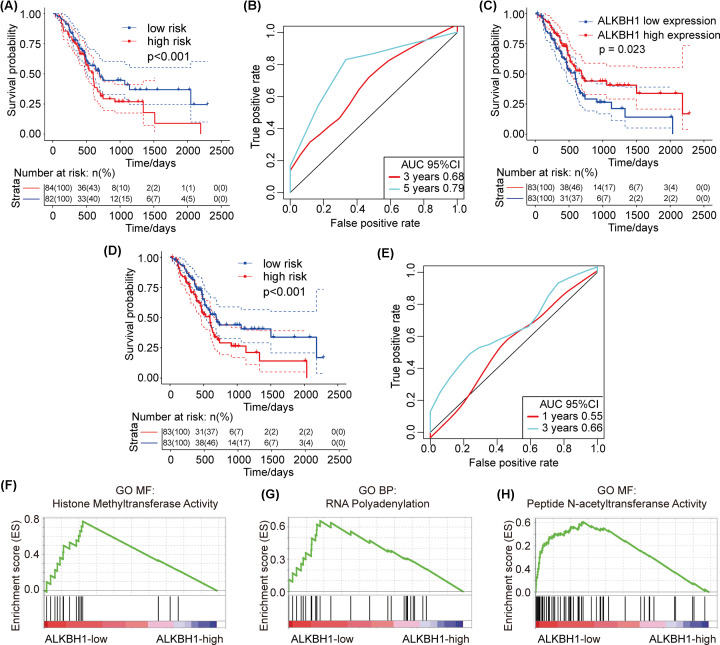
Figure 5. Survival and AUC in PAAD patients and GSEA results of different expression levels of ALKBH1.
(A) Survival curve of multivariate Cox regression. (B) AUC curve of multivariate Cox regression. (C) The relationship between ALKBH1 expression and patient prognosis. (D) Risk analysis of the ALKBH1 gene. (E) AUC of the ALKBH1 gene. (F–H) GSEA results of ALKBH1 expression. (F) histone methyltransferase activity. (G) RNA polyadenylation. (H) peptide N-acetyltransferase activity.

