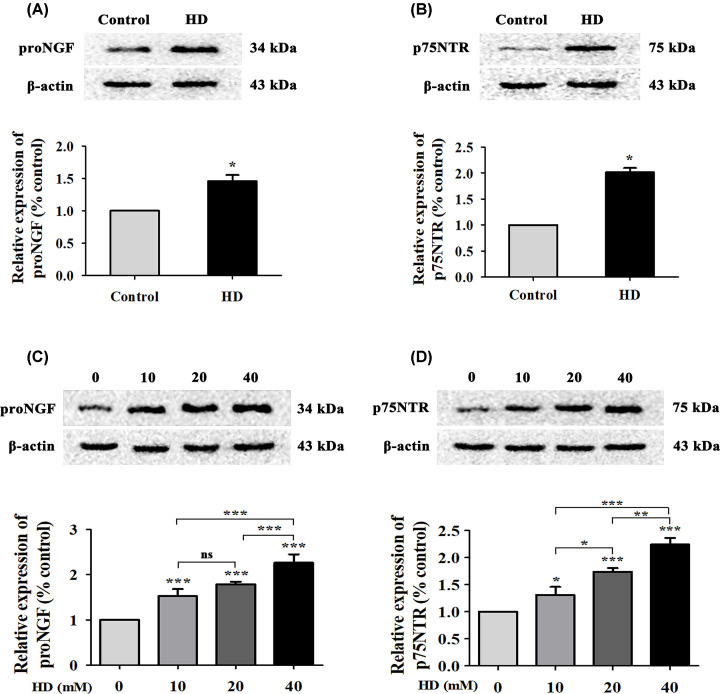
Figure 3. HD up-regulated proNGF and p75NTR levels in rat spinal cords and in cultured VSC4.1 cells.
ProNGF (A) and p75NTR (B) expression levels in spinal cord tissues of rats were detected via WB. ProNGF (C) and p75NTR (D) expression in VSC4.1 cells treated with different concentrations of HD (0, 10, 20, 40 mM) was detected via WB. Quantified data are shown as mean ± SEM (n=3 biological replicates). Statistical analysis was performed using one-way ANOVA, the LSD test, or Dunnett’s multiple-comparison test. *P<0.05, **P<0.01, ***P<0.001; ns, non-significant. Asterisks indicate statistically significant differences between groups in square brackets.

