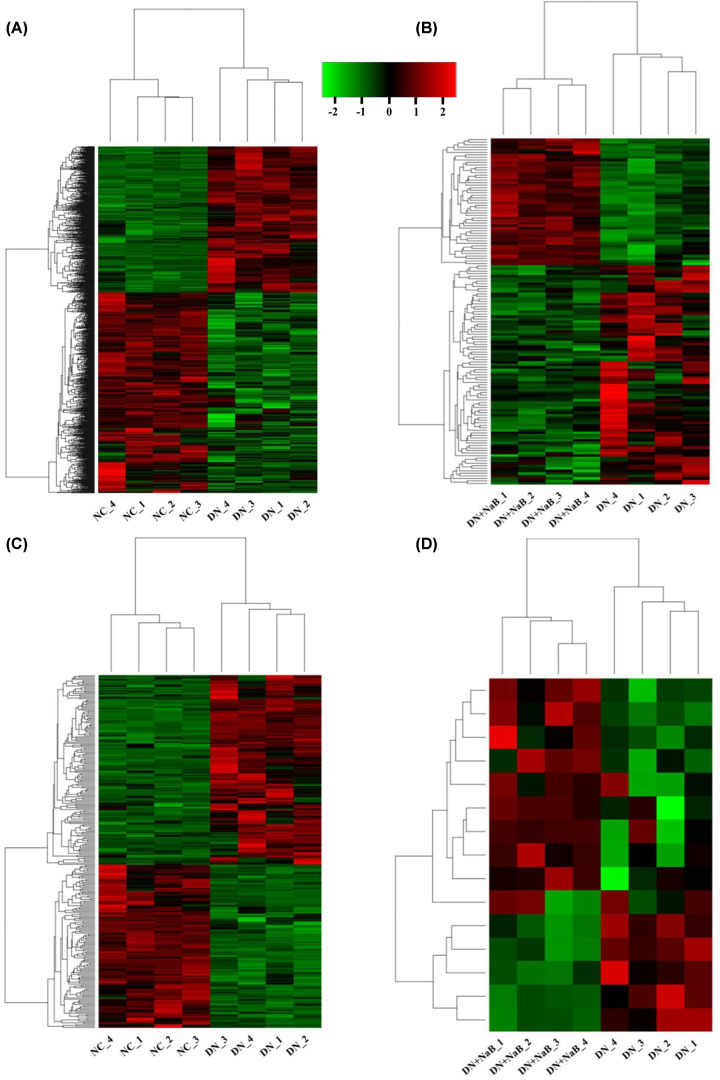
Figure 2. Heatmap showing the expression profiles of mRNAs and lncRNAs.
(A,B) Differentially expressed mRNAs in NC vs DN mice (A) and the DN vs DN+NaB groups (B) (log2FC > 0.585 or log 2 FC < −0.585, FDR < 0.05, n=4). (C,D) Differentially expressed lncRNAs in NC vs DN mice (C) and the DN vs DN+NaB groups (D) (log2FC > 0.585 or log2FC < −0.585, FDR < 0.05, n=4). Hierarchical clustering and heat mapping are performed to investigate the differences in genes among various groups. Each row represents a single gene and each column represents a single tissue sample.

