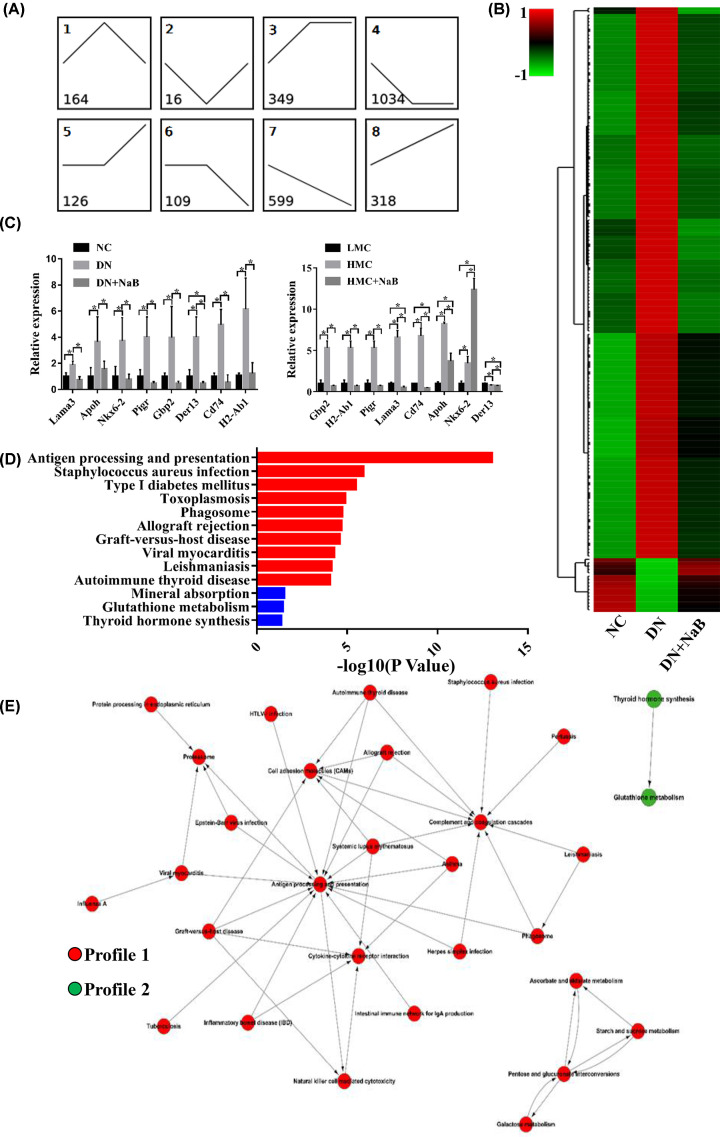
Figure 3. Reversely changed mRNAs following NaB treatment are enhanced in terms of certain biological functions.
(A) Model-based expression profiles (profiles 1–8) of mRNAs expressed differentially for the NC, DN and DN+NaB groups. The number at the top-left denotes the profile ID, and the number at the bottom-left denotes the mRNA count. (B) Hierarchical clustering and heatmaps showing those reversed mRNAs (profiles 1 and 2) differentially expressed in the NC, DN and DN+NaB groups. (C) The eight reversed mRNAs detected by qRT-PCR in DN mice and mice mesangial cells. The histogram at the top shows the mRNA expression in the NC, DN and DN+NaB groups (n=4 in each group). The histogram at the bottom represents the mRNA expression in mice mesangial cells (MC) treated with 5.5 mM glucose (LMC), 25 mM glucose (HMC) or HMC treated with 5 mM NaB (HMC+NaB). The data are representative of three independent experiments. *P<0.05. (D) KEGG pathway enrichment analysis of reversed mRNAs depicting the top 13 significant (P<0.05) pathways. The red row represents the profile 1-type mRNA enriching pathway, and the blue row represents the profile 2-type mRNA enriching pathway. (E) Pathway-Act-Network according to the overlaps and links between associated molecules in the top 13 significant canonical pathways. The red nodes indicate that the signaling pathway with profile 1-type mRNA enrichment and the green nodes indicate the signaling pathway with profile 2-type mRNA enrichment.

