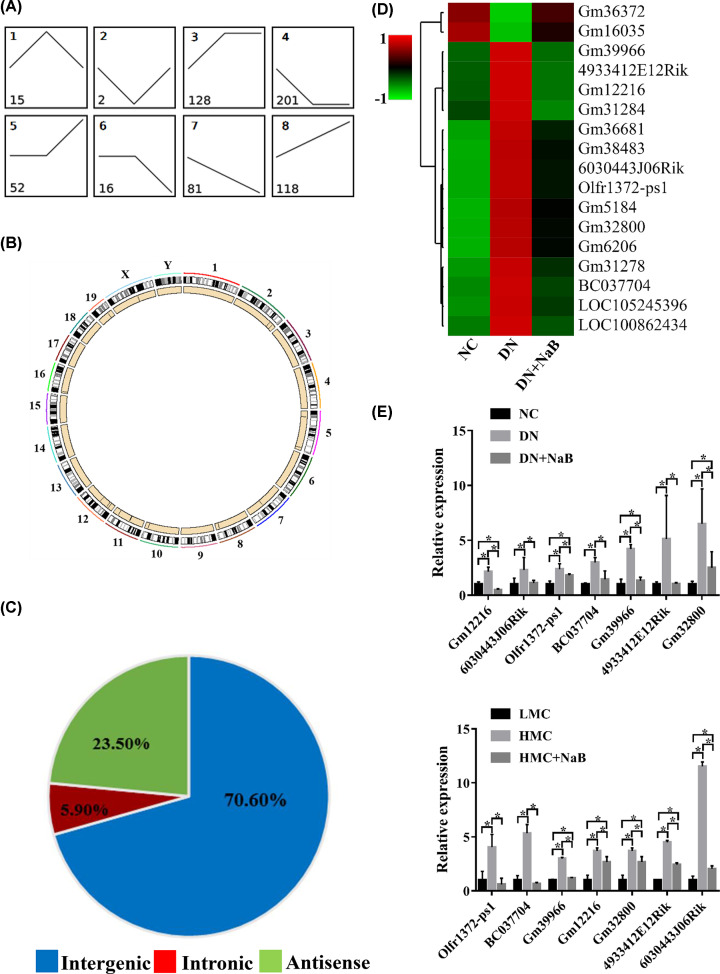
Figure 4. LncRNAs are reversely changed following NaB treatment in the DN mouse model.
(A) Model-based expression profiles (profile 1–8) of lncRNAs expressed differentially for the NC, DN and DN+NaB groups. Numbers in the profiles indicate profile IDs (top-left) and lncRNA counts (bottom-left). (B) Circos plot showing reversed lncRNAs in mouse chromosomes. The outermost layer of the circos plot is the chromosome map of the mouse genome—the larger inner circle indicates the reference genome localization. The smaller inner circle indicates the outline of the chromosome, and the position of the reversed inverted lncRNA is marked using a black line. (C) Pie charts showing the proportions of three types of reversed lncRNAs (profiles 1 and 2) in the NC, DN and DN+NaB groups. (D) Hierarchical clustering and heatmaps showing the reversed lncRNAs (profiles 1 and 2) differentially expressed in the NC, DN and DN+NaB groups. (E) The seven reversed lncRNAs detected using qRT-PCR in DN mice and mice mesangial cells. The top shows the expression of reversed lncRNAs in the NC, DN and DN+NaB groups (n=4 in each group) and the bottom shows the expression of reversed lncRNAs in the LMC, HMC and HMC+NaB groups (triplicate experiments). *P<0.05.

