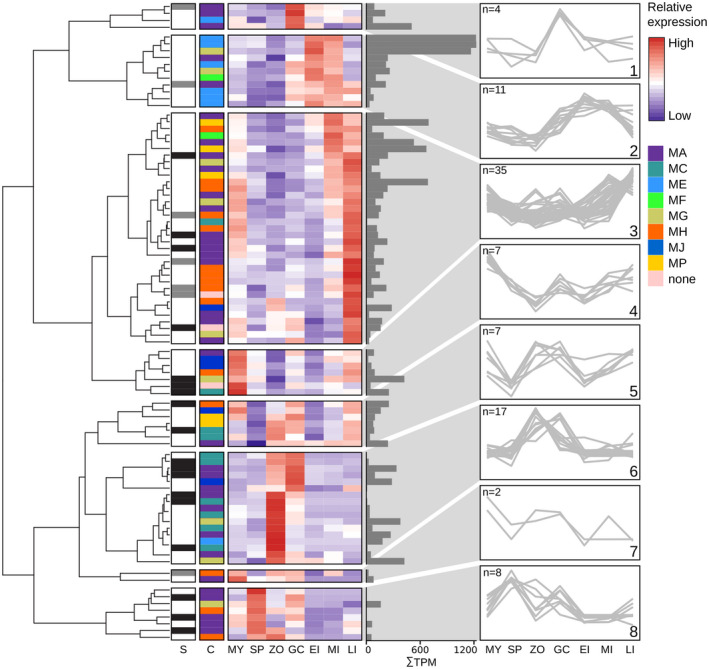
FIGURE 5.

Clustering of Phytophthora infestans metalloprotease (MP) genes based on expression patterns during asexual development and in planta growth. The dendrogram on the left shows the hierarchical clustering of expression patterns. Column S marks MPs with a predicted signal peptide (dark grey) or signal anchor (light grey). Colour‐coded bars in column C indicate MEROPS clans. The heatmap depicts relative expression per gene based on stage‐wise, Z‐score transformed expression values in mycelium (MY), sporangia (SP), zoospores (ZP), germinating cysts (GC), and early, mid, and late infection stages (EI, MI, and LI, respectively). The adjacent bar plot shows mean transcripts‐per‐million mapped reads (TPM) values. Line plots on the right display the expression profiles of the eight clusters and number (n) of genes per cluster. Further details can be found in Table S2
