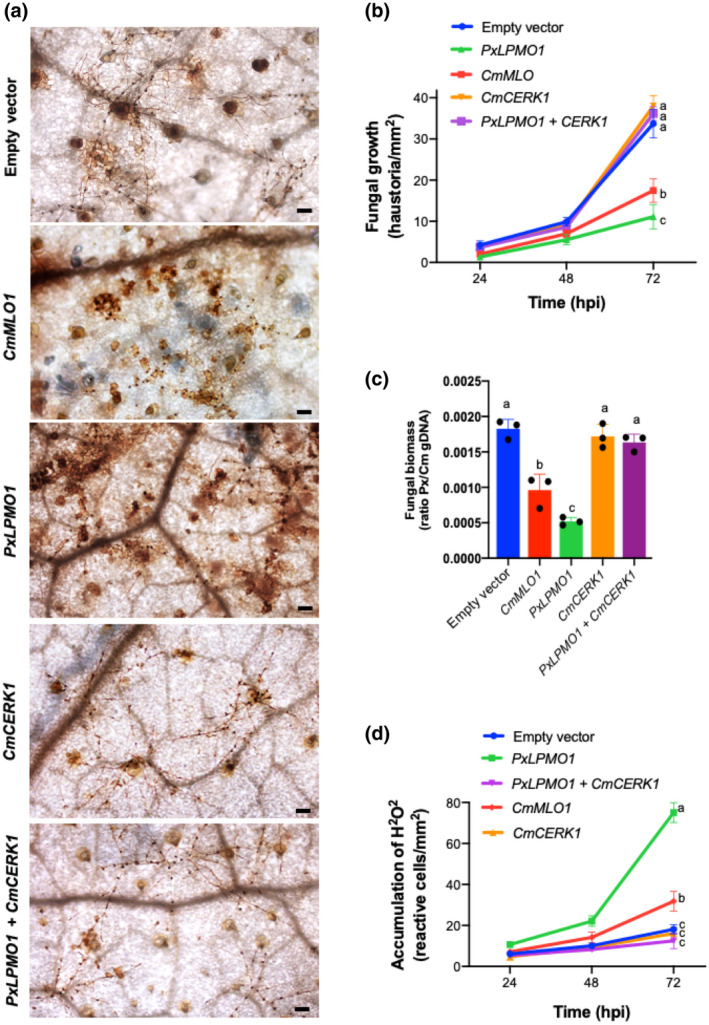
FIGURE 7.

Effect of co‐silencing of PxLPMO1 and the melon chitin receptor kinase gene CmCERK1 on fungal growth and the oxidative burst. RNAi silencing was carried out by Agrobacterium tumefaciens‐mediated host‐induced gene silencing. The empty vector was used as a negative control, and RNAi silencing of the melon CmMLO1 gene was used as a positive control. (a) Visualization of fungal structures and oxidative bursts. Detection of H2O2 was performed by the 3,3′‐diaminobenzidine uptake method. Pictures were taken at 24, 48, and 72 hr after inoculation (hpi) with Podosphaera xanthii. Fungal hyphae and haustoria (black dots) are easily recognized. The brown colour indicates the presence of reactive epidermal cells with H2O2 production. Bars = 100 μm. (b) Estimation of fungal growth by haustorial counting. The growth of P. xanthii is expressed as the number of haustoria per mm2 of transformed tissue. The values are the means of 30 samples from three independent experiments ± standard error. (c) Molecular estimation of P. xanthii growth. Cotyledon samples were taken at 72 hpi and were used for the isolation of genomic DNA. The ratios of P. xanthii to melon cotyledon genomic DNA (Px/Cm gDNA) were determined by quantitative PCR as indicated in Figure 5c. Bars indicate the means ± standard errors of three technical replicates from three different DNA samples each derived from five pooled cotyledons. (d) Time course analysis of H2O2 production by epidermal cells. Detection of H2O2 was performed by the DAB uptake method. The reactive epidermal cells were identified as containing brown‐red precipitates (Figure 5a, asterisks). Data represent the number of reactive cells per mm2 and are the means of 30 samples from three independent experiments ± standard error. Different letters in (b), (c), and (d) indicate values significantly different at p = .05 according to Fisher's least significant difference test (LSD)
