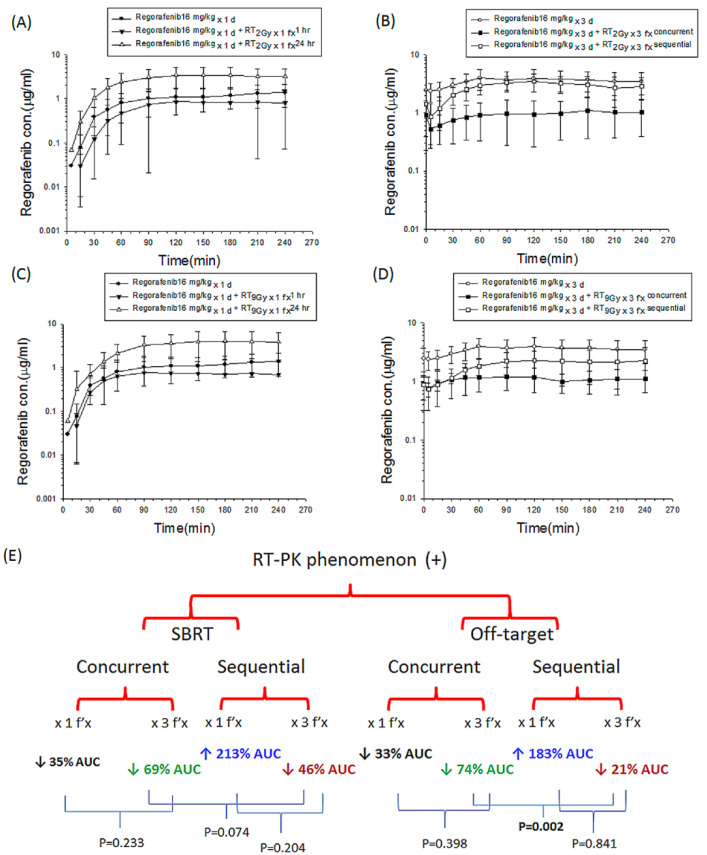
Figure 3.
The concentration versus time curves of regorafenib in the plasma of rats obtained for different time courses with or without irradiation (RT). (A) The one fraction groups included a sham group, regorafenib with RT0 Gy (regorafenib × 1 d); a concurrent group treated with regorafenib 1 h after RT2 Gy with 1 fraction (RT2 Gy × 1 f’x); and a sequential group treated with regorafenib 24 h after RT2 Gy × 1 f’x. (B) The multiple fraction treated groups included a sham group, regorafenib (p.o., q.d. × 3 d) with RT0 Gy (regorafenib × 3 d); a concurrent group treated with regorafenib (p.o., q.d. × 3 d) 1 h after RT2 Gy with 3 fractions (RT2 Gy × 3 f’x); and a sequential group treated with regorafenib 24 h (p.o., q.d. × 3 d) after RT2 Gy × 3 f’x. (C) The one fraction treatment group included a sham group, regorafenib × 1d; a concurrent group treated with regorafenib 1 h after RT9 Gy × 1 f’x and a sequential group treated with regorafenib 24 h after RT9 Gy × 1 f’x. (D) The multiple fraction groups included a sham group, regorafenib × 3 d; a concurrent group treated with regorafenib (p.o., q.d. × 3 d) 1 h after RT9 Gy × 3 f’x; and a sequential group treated with regorafenib 24 h (p.o., q.d. × 3 d) after RT9 Gy × 3 f’x. (E) The changes in the area under the concentration versus time curve (AUC) of regorafenib with or without RT. Data are expressed as the mean ± SEM (n = 6 for each group).

