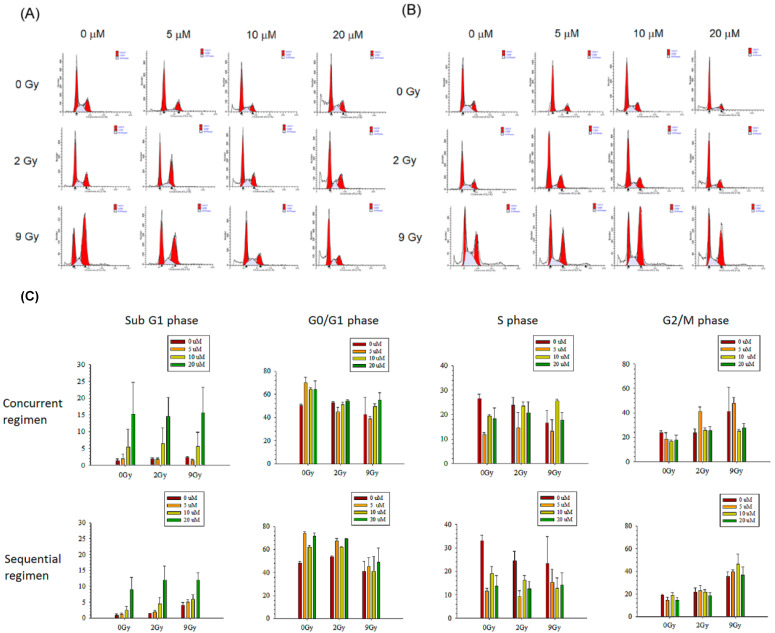
Figure 6.
Huh-7 cells were treated with regorafenib at concentrations of 0, 5, 10 or 20 μmol/L (μM). (A) The percentage of hypodiploid cells (sub-G1) was quantified in plates 1 h after irradiation (concurrent group) with sham RT (RT0 Gy), 2 Gy (RT2 Gy) and 9 Gy (RT9 Gy). (B) The percentage of hypodiploid cells (sub-G1) was quantified in plates 24 h after irradiation (sequential group) with different RT doses. (C) Bar graphs showing the cell cycle distributions of the different treatment regimens. Data from three separate experiments are expressed as the mean ± standard error of the mean (SEM).

