
Figure 2. ePBAE screening based on cell viability and transfection efficacy.
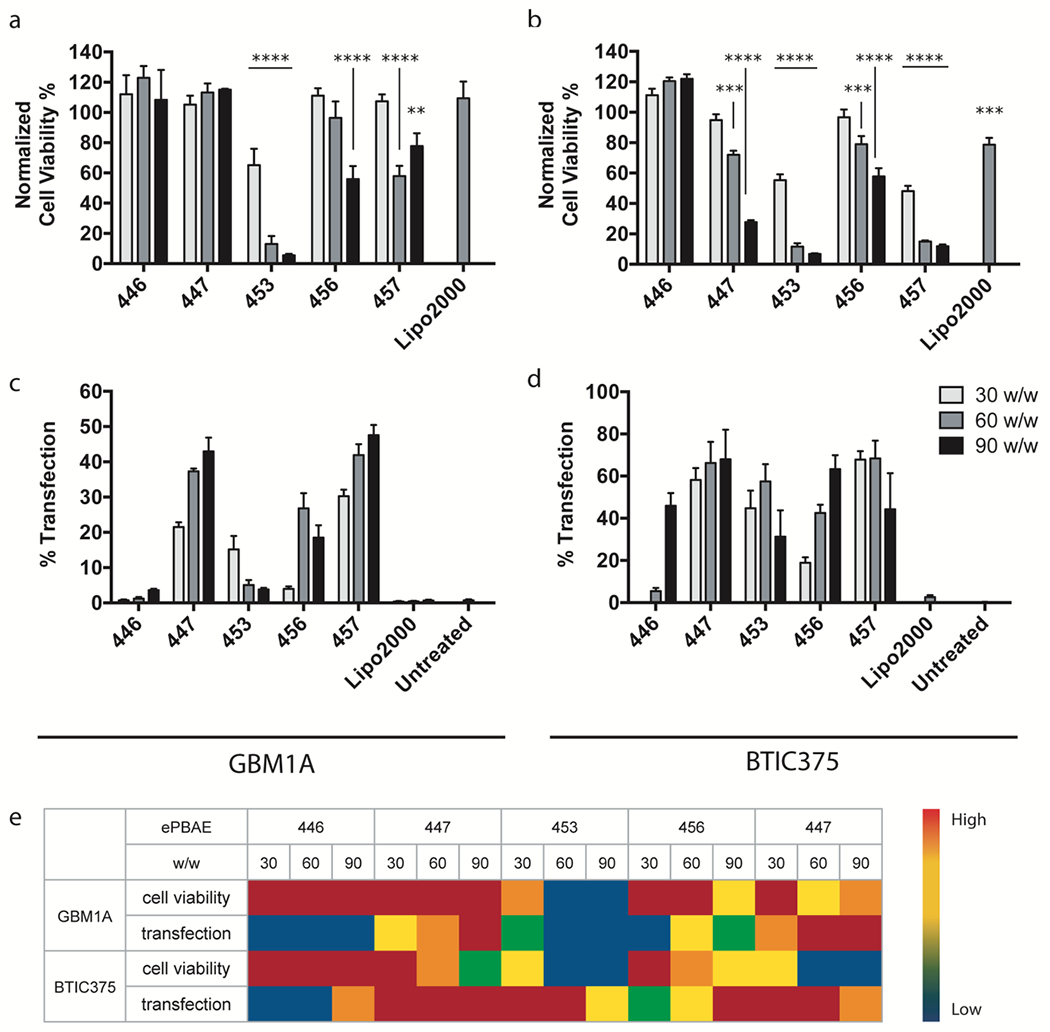
Cell viability of (a) GBM1A and (b) BTIC375 cells from incubation with 15 different ePBAE NP formulations normalized to untreated control determined by MTS assay (n = 4, mean ± s.d., *: p < 0.05 compared to untreated control). pEGFP transfection efficacy of 15 ePBAE NP formulations in (c) GBM1A and (d) BTIC375 cells determined by flow cytometry (n = 4, mean ± s.d.). (e) 5-scale heat map of cell viability and transfection efficacy from 15 ePBAE NP formulations in both cell types.