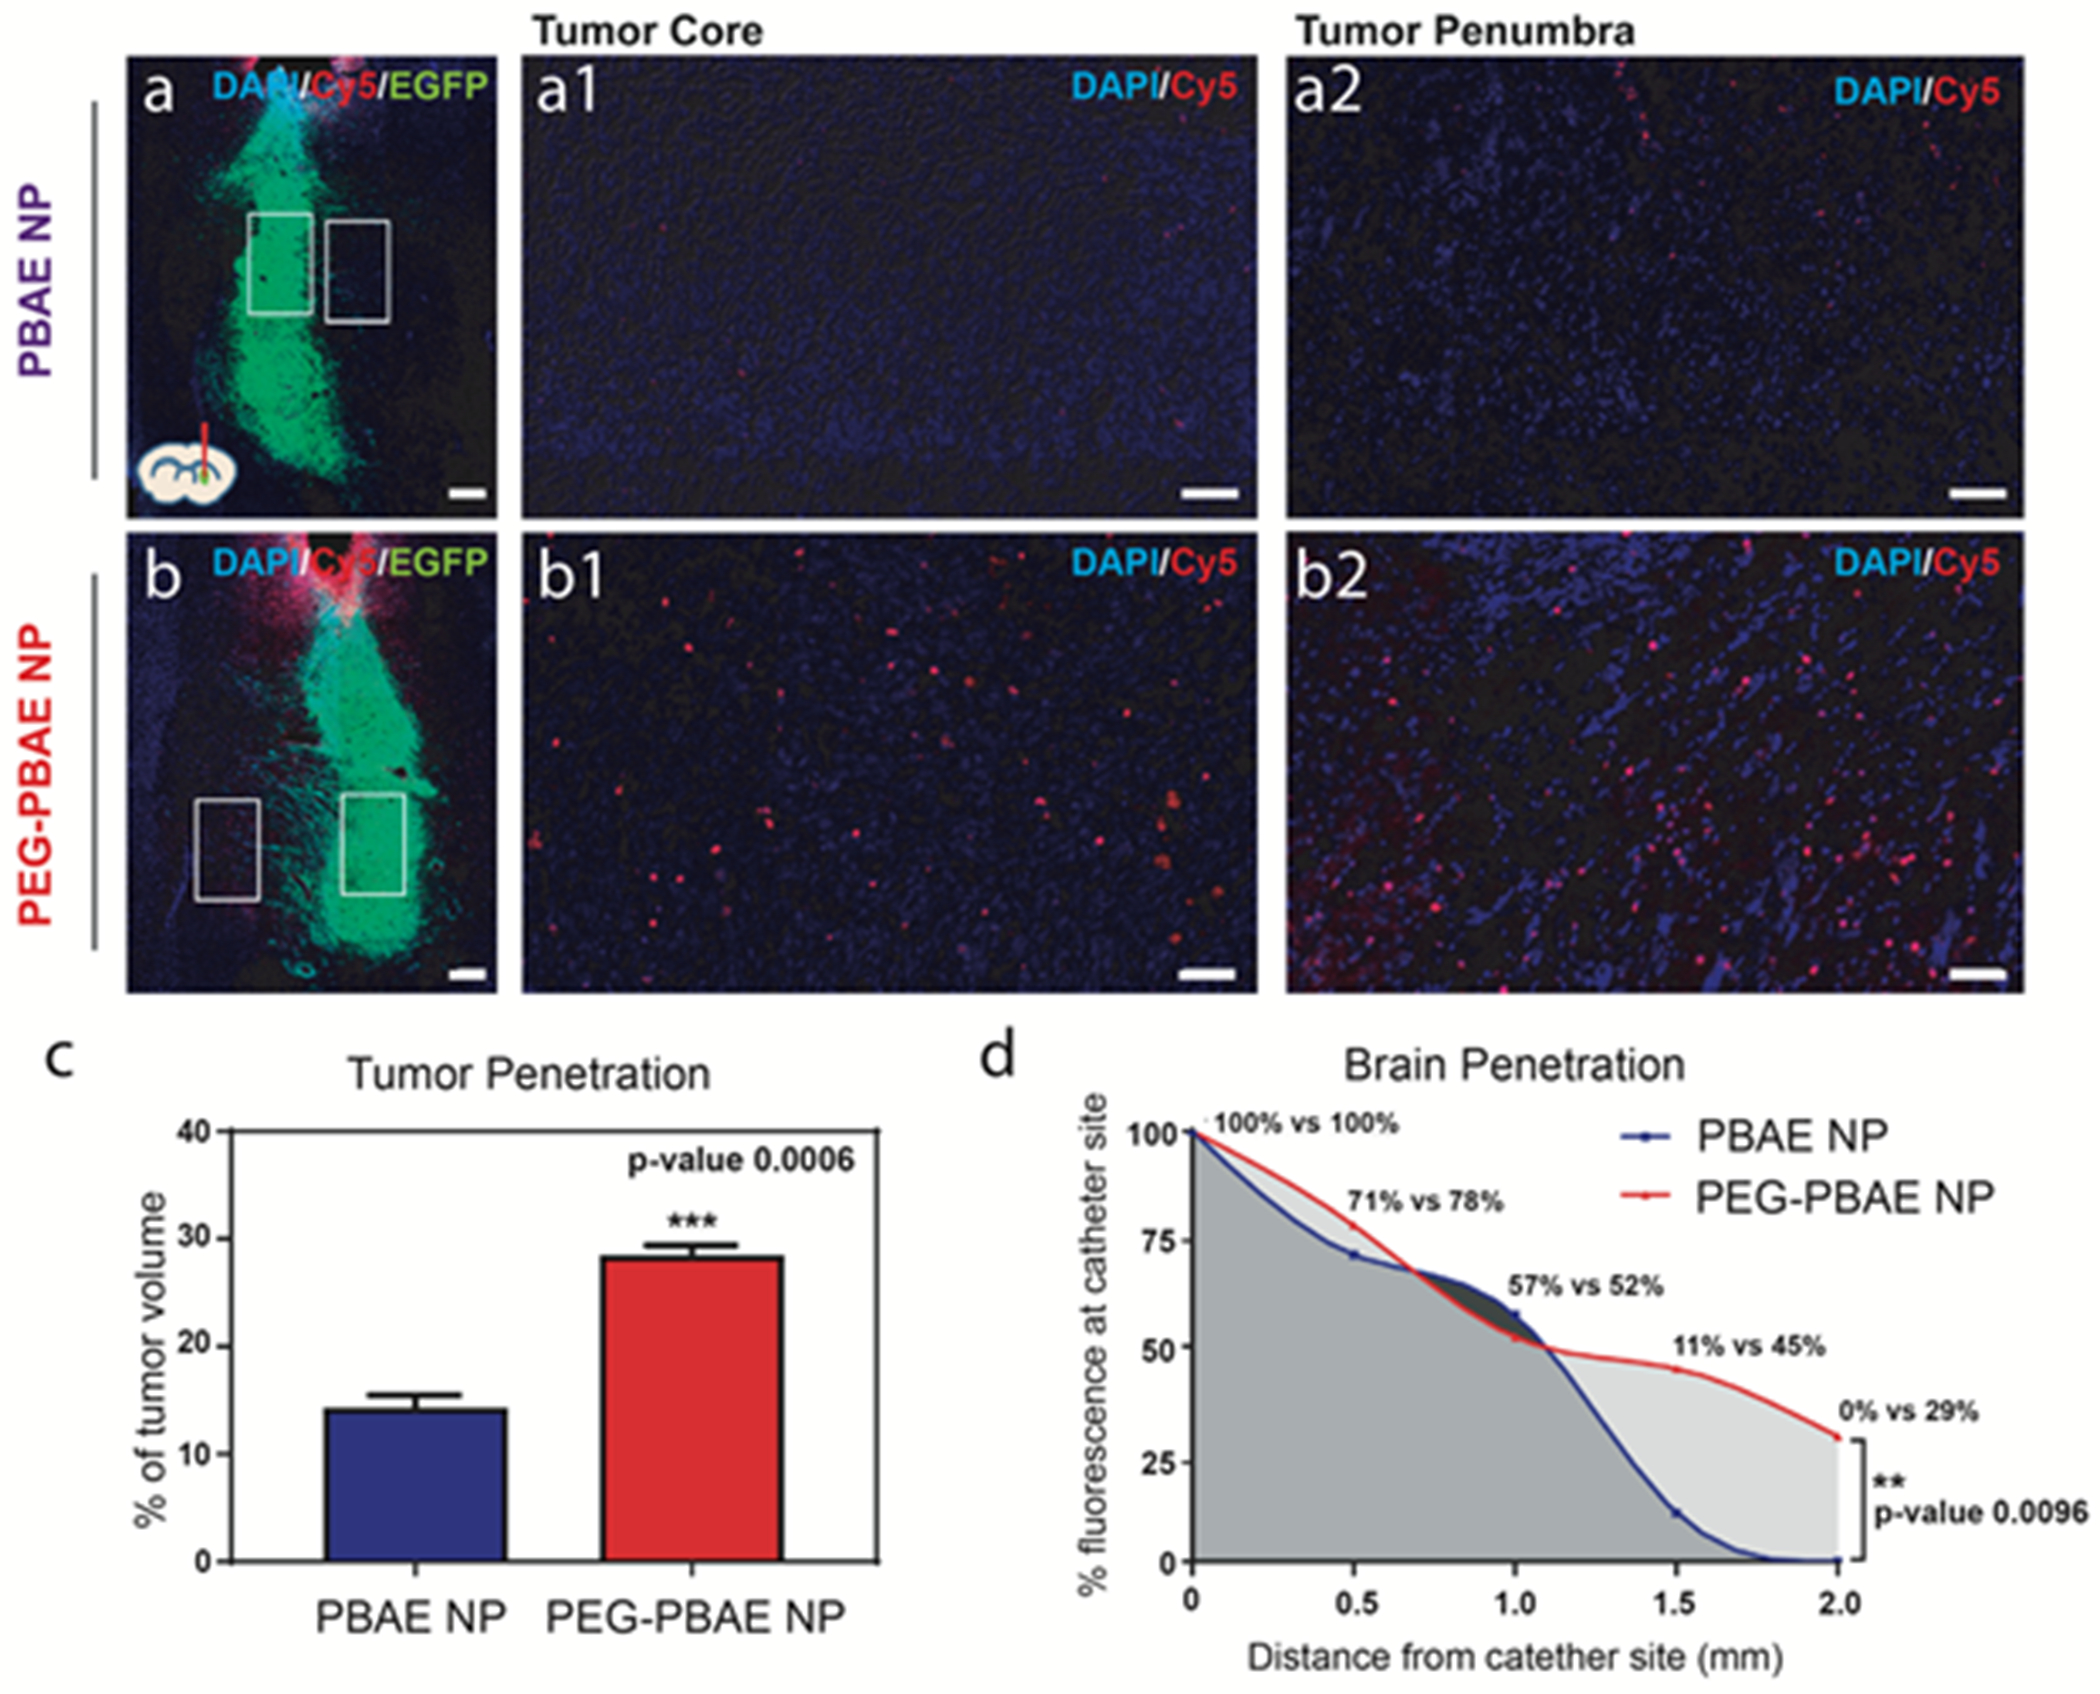
Figure 6. NP distribution in the brain after CED-assisted administration.

Confocal microscopy images of representative frozen sections from the brain injected with (a) PBAE (447 60 w/w) or (b) PEG-PBAE (447 + 44-PEG0.8k 1:1 30 w/w) NPs (scale bar = 200 μm, DAPI: nuclei, Cy5: NP, EGFP: GBM1A cells). Higher magnification images of (a1/b1) tumor core regions and (a2/b2) tumor penumbra regions indicated by red and orange boxes respectively in (a) and (b) (scale bar = 50 μm). (c) Quantification of tumor penetration by % tumor volume, analyzed from the confocal images with ImageJ and Cavalieri’s principle (n = 3, mean ± s.d., *: p < 0.05). (d) Quantification of brain penetration, analyzed as mean % Cy5 fluorescence intensity in subdivided rectangular ROI in confocal images at 500μm intervals beginning at the site of catheter implantation (n = 2, *: p < 0.05).
