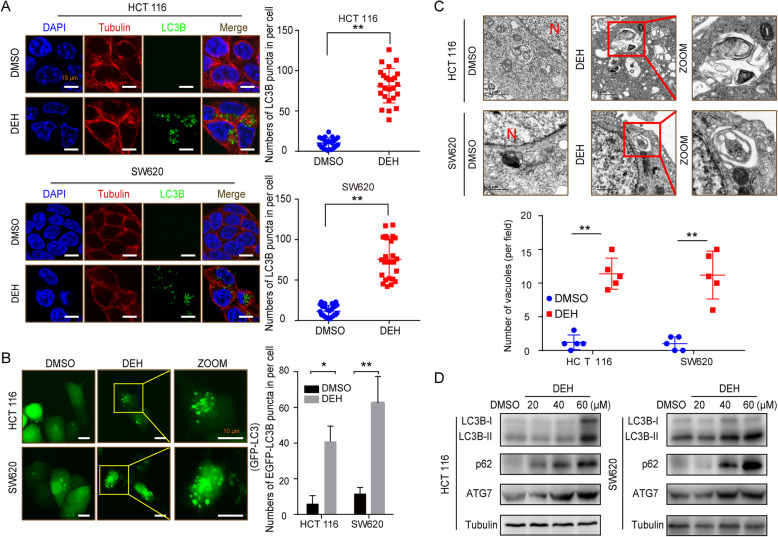
Fig. 3.
DEH induces autophagy in colorectal cancer cells. a Immunofluorescence staining of LC3B (green) and tubulin (red) in HCT 116 and SW620 cells treated with or without 60 μM DEH for 48 h. The nuclei were counterstained with DAPI (blue). Scale bars: 15 μm. The histogram shows quantification of the percentage of cells with LC3B puncta. b Fluorescence images of GFP-MAP 1LC3B puncta in HCT 116 and SW620 cells incubated with or without 60 μM DEH for 48 h. GFP-MAP 1LC3B puncta were quantified and presented in the bar chart on the right. Scale bars: 10 μm. c Autophagic vesicles detected by TEM in HCT 116 and SW620 cells treated with or without 60 μM DEH for 48 h. Scale bar: 1 μm. N: nucleus. d Protein levels of LC3B, p62, and ATG7 were detected by western blotting after HCT 116 and SW620 were treated with the indicated concentrations of DEH for 48 h. The densitometry of western blotting is shown to the right of the pane. The statistical results are presented as mean ± SD. All the data were analyzed by using the Unpaired Student’s t-test and p-values less than 0.05 were considered to be statistically significant. *p < 0.05, **p < 0.01, ***p < 0.001

