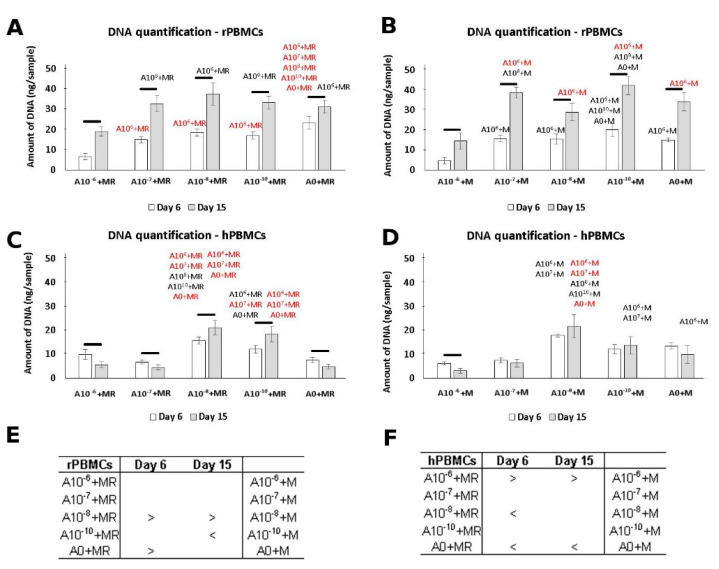
Figure 1.
Peripheral blood mononuclear cells (PBMCs), with proliferation measured using the Quant-iT™ dsDNA Assay Kit to quantify the amount of DNA. rPBMCs cultured in the presence of M-CSF and RANKL (A); rPBMCs cultured in the presence of M-CSF (B); hPBMCs cultured in the presence of M-CSF and RANKL (C); hPBMCs cultured in the presence of M-CSF (D). Statistical significance is denoted above the columns. Statistical significance among the tested groups within one experimental day is given by sample name (black p < 0.05, red p < 0.001). Comparison within the same group between Days 6 and 15 is marked with a line above the respective columns. Comparison across the groups with the same concentration of ALN on Days 6 and 15 was performed to identify the pair-wise differences. It is stated in Tables (E) and (F) for rat and human PBMCs, respectively (p < 0.05). Data are presented as mean ± standard deviation.

