Fig. 1.

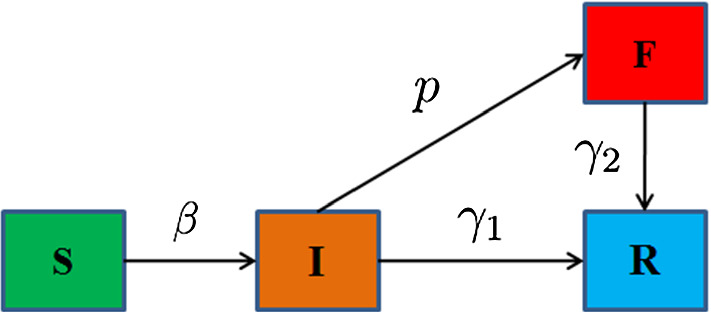
The transmission diagram of COVID-19 in Harbin. Where S, I, F and R represent the susceptible people, unfound infected people, found infected people and removed people

The transmission diagram of COVID-19 in Harbin. Where S, I, F and R represent the susceptible people, unfound infected people, found infected people and removed people