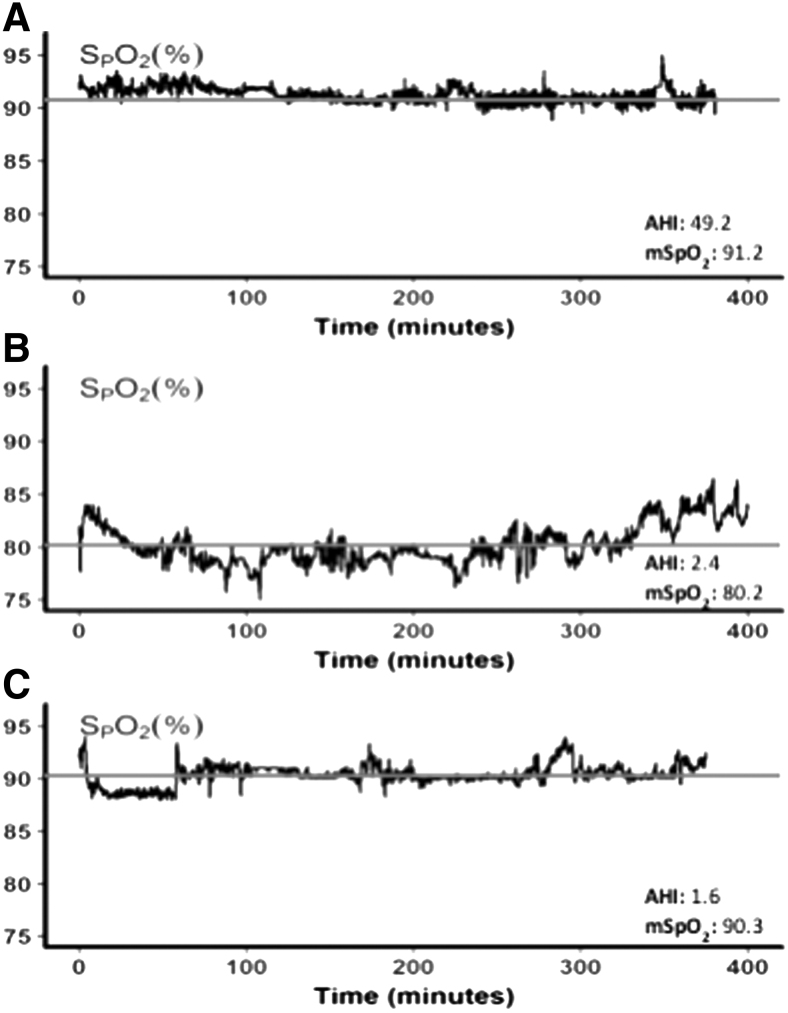
FIG. 1.
Illustrative nocturnal oxygen profiles at high altitude. SpO2 versus time (hours) for illustrative nocturnal sleep recordings during the first night at HA. Top panel (A) illustrates the trace of a representative subject with intermittent hypoxemia with relatively high mean SpO2. Middle and bottom panels (B, C) exhibit different nocturnal SpO2 tracings of representative subjects from subgroups with marked and mild reductions in mean SpO2 and no significant sleep apnea, respectively. Red line shows the mean nocturnal SpO2 during the night. AHI values are reported for each tracing. AHI, Apnea–Hypopnea Index; HA, high altitude; SpO2, oxyhemoglobin saturation.

