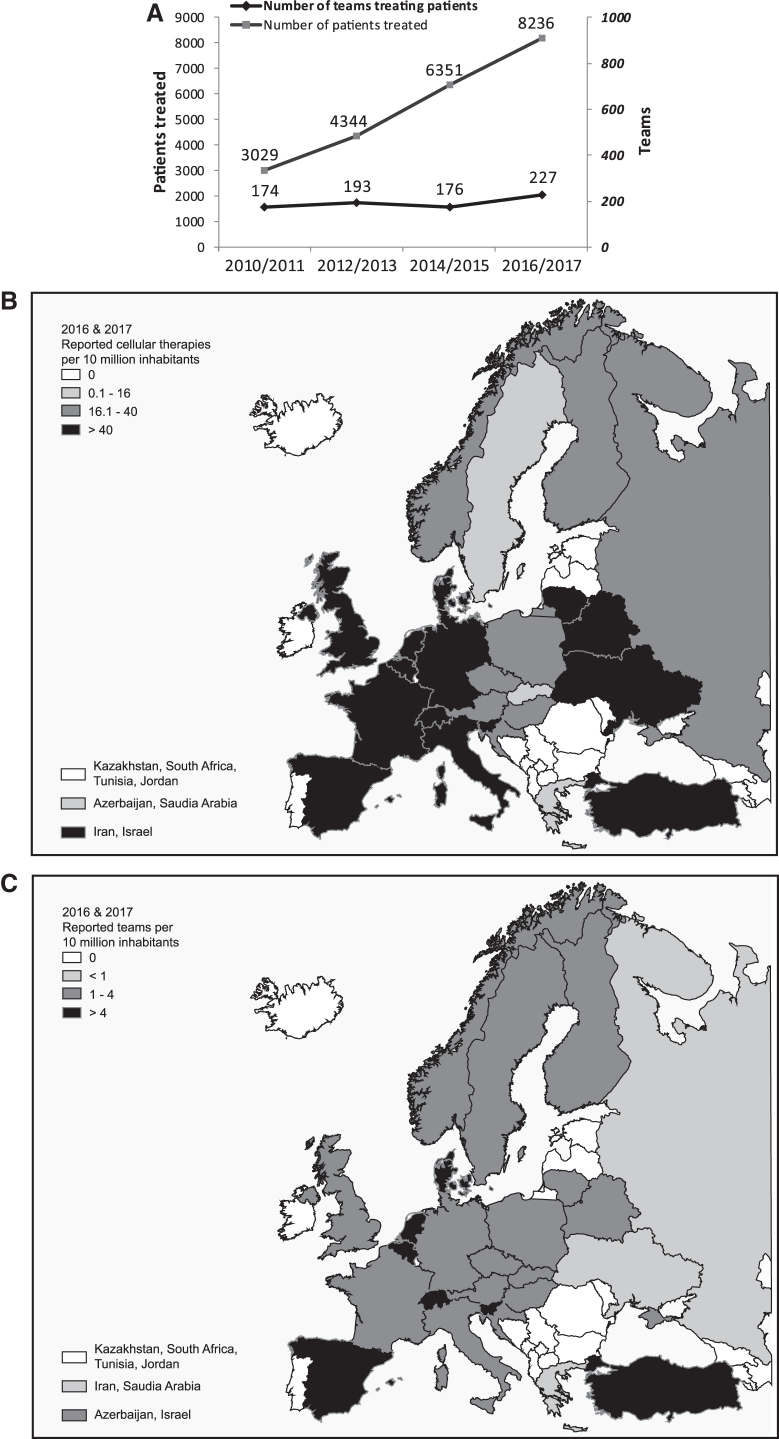
FIG. 1.
(A) Number of reporting teams and patients treated using cell and tissue-engineered therapies in two consecutive years from 2010 to 2017. Data used for this chart were derived from this study and previous reports (1–5). Number of cell and tissue-engineered therapies (B), and teams (C) per 10 million inhabitants reported in Europe for the combined years of 2016 and 2017.

