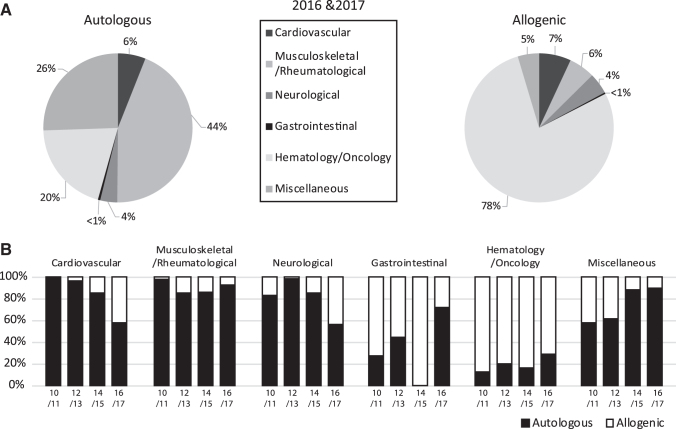
FIG. 2.
(A) Percentage of indications for cell and engineered tissue therapies in Europe for the combined years of 2016 and 2017, sorted by donor type. (B) Comparative analysis of indications for cell and tissue-engineered therapies in Europe in two consecutive years from 2010 to 2017, sorted by donor type. Data used for this chart were derived from this study, and five previous reports (1–5).

