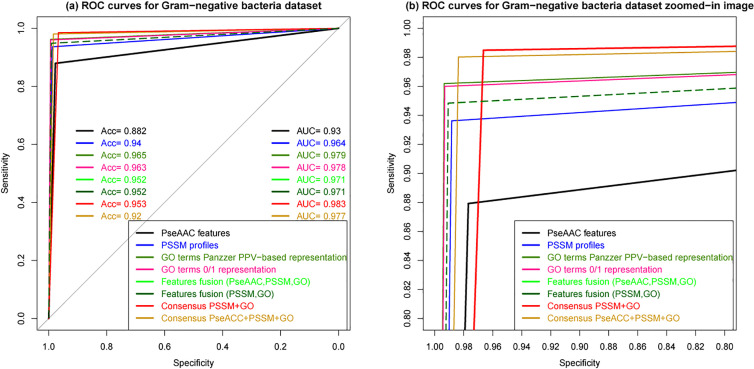
Figure 6:
ROC curves of cross-validation tests on Gram-negative bacteria dataset for different predictions pseudo-amino acid composition (PseAAC), PSSM profiles, GO terms 0/1-based representation, GO terms PPV-based representation, features fusion, a consensus prediction using both GO terms and PSSM profiles outputs and a consensus of PseAAC, GO terms, PSSM profiles outputs. In (b) the zoomed-in image of the different curves.

