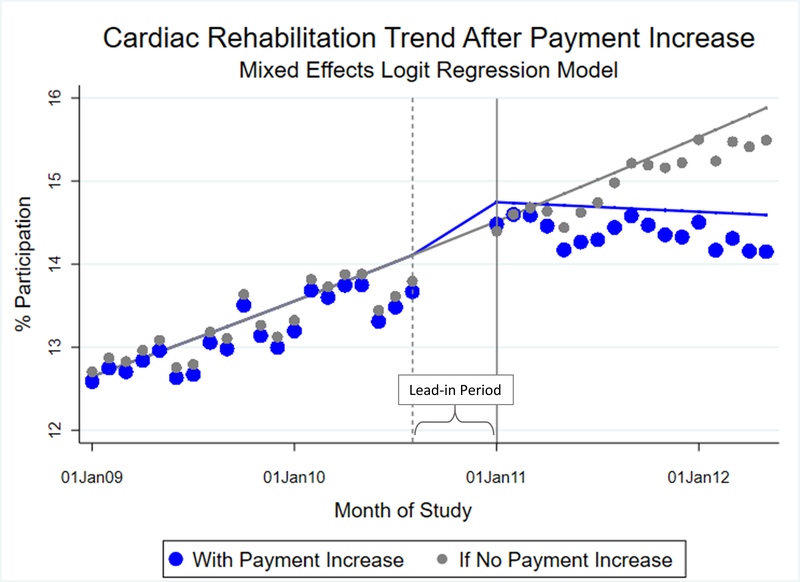
Figure 3.
Average Predicted Cardiac Rehabilitation Participation by Month with Fitted Model, from 2009 to 2012.
Adjusted trends evaluated at the mean of the covariates and coefficients from the mixed effects regression model are presented. The solid vertical line represents the date the payment for cardiac rehabilitation increase was implemented, January 1, 2011. The dashed vertical line represents the start of the lead-in period. Patients whose index events occurred between September 1, 2010 and December 31, 2010 were excluded during this lead-in period because their 4-month episodic window spanned the date the new payment was implemented. Model predictions were estimated using covariate means at each timepoint. Large blue circles represent the values predicted by the model for the periods before and after the payment increase, which includes the fixed covariate effects and hospital (group) random effects. Small gray circles represent values predicted if the payment had not increased (counterfactual). To plot the systematic relationship between payment and CR participation, we predicted the fixed covariate effect without the hospital random effects for the adjusted regression model (blue) and the counterfactual (grey).

