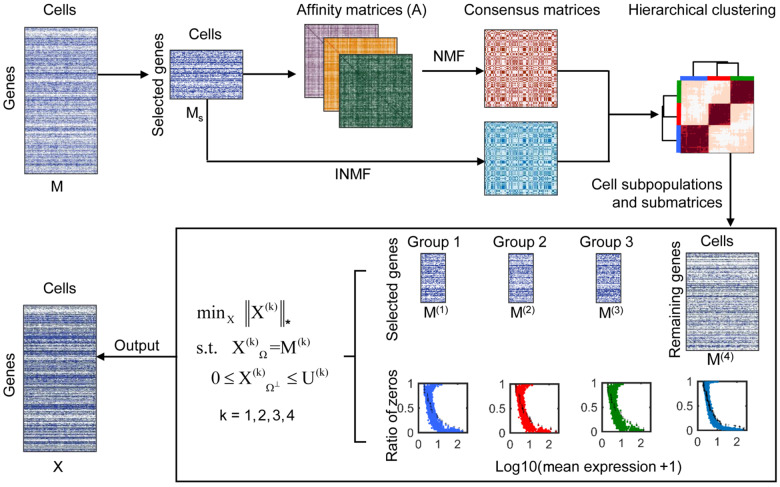
Figure 1.
Overview of PBLR. Given a gene expression matrix M as input, PBLR outputs an imputed data matrix X with the same size as M. PBLR first extracts the data of the selected high variable genes and computes three affinity matrices based on Pearson, Spearman, and Cosine metrics, respectively. Then, PBLR learns a consensus matrix by performing SymNMF of the three affinity matrices INMF of the sub-matrix of selected genes. PBLR further infers cell sub-populations by performing hierarchical clustering of the consensus matrix. Finally, PBLR estimates the expression upper boundary of the ‘dropout’ values, and recovers zero gene expressions by performing a bounded low-rank recovery model on each submatrix determined by each cell sub-population. In this diagram, there are three cell sub-populations. M(1), M(2), M(3) are the sub-matrices of the selected genes for each population, and M(4) is the sub-matrix of the remaining genes.

