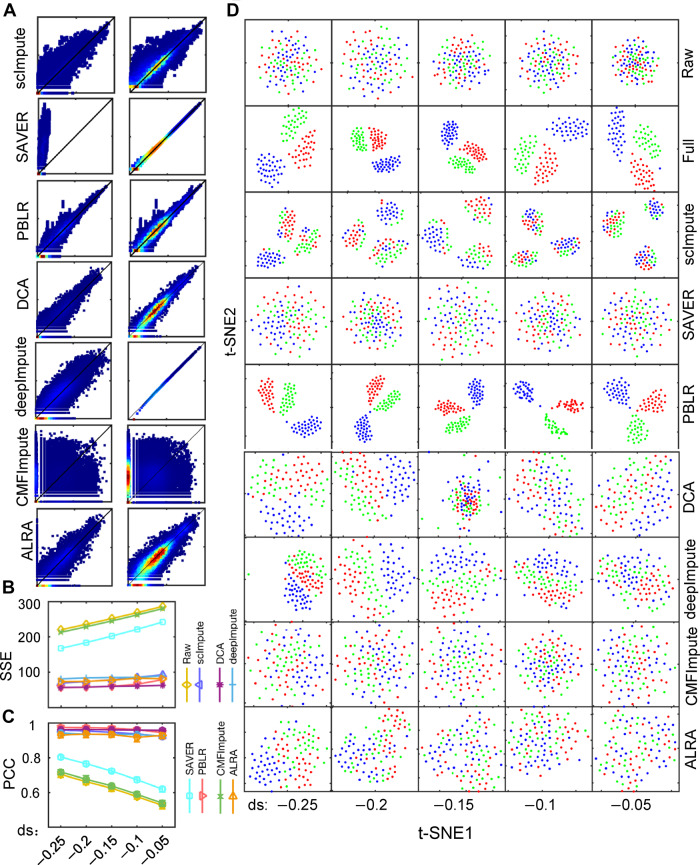
Figure 2.
Imputation performance of scImpute, SAVER, PBLR, DCA, deepImpute, CMFImpute, and ALRA on synthetic dataset 2 with various dropout rates. (A) Density plot of the imputed values vs. true ones in the zero space (left) and the non-zero space (right), respectively. Y-axis is log10(real value +1), while x-axis is log10(imputed value +1). (B) SSE values computed between the full data and the raw data, as well as imputed ones, respectively. (C) PCC values computed between the full data and the raw data, as well as imputed ones by scImpute, SAVER, PBLR, DCA, deepImpute, CMFImpute, and ALRA, respectively. (D) Visualization of cells on the first two t-SNE components using the raw data and imputed ones by scImpute, SAVER, PBLR, DCA, deepImpute, CMFImpute, and ALRA, respectively. Each column represents data with one dropout rate. ds means the parameter of dropout.shape in splatter package, which controls the ratio of zeros and larger value represents higher ratio of zeros in the data.

