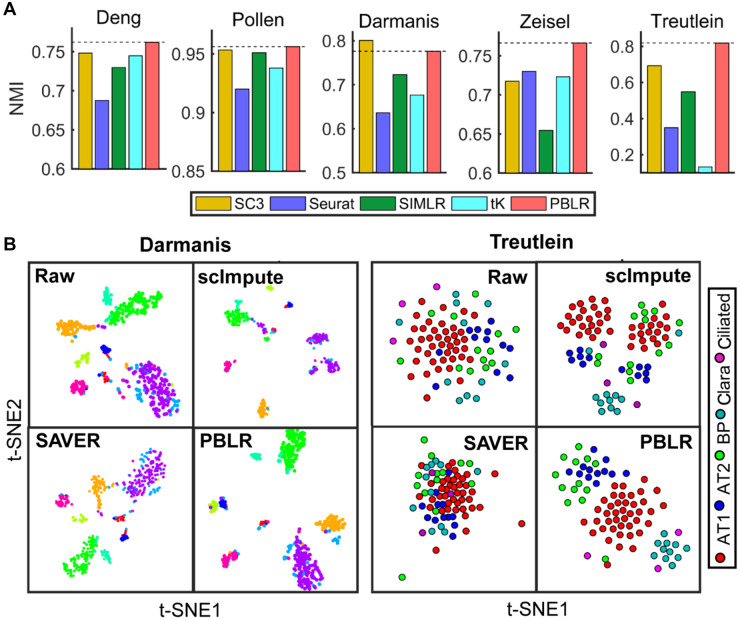
Figure 5.
Clustering performance of PBLR and other competing methods on five real datasets. (A) SC3, Seurat, SIMLR, tK, and PBLR were applied to the five real scRNA-seq datasets, where cell cluster labels were known or validated in the original studies. tK represents k-means on the first two t-SNE dimensions. Normalized mutual information (NMI) is used to quantify accuracy. (B) Cells are visualized on the first two t-SNE components using the raw Darmanis (left) and Treutlein (right) data and imputed ones by PBLR, scImpute, and SAVER, respectively.

