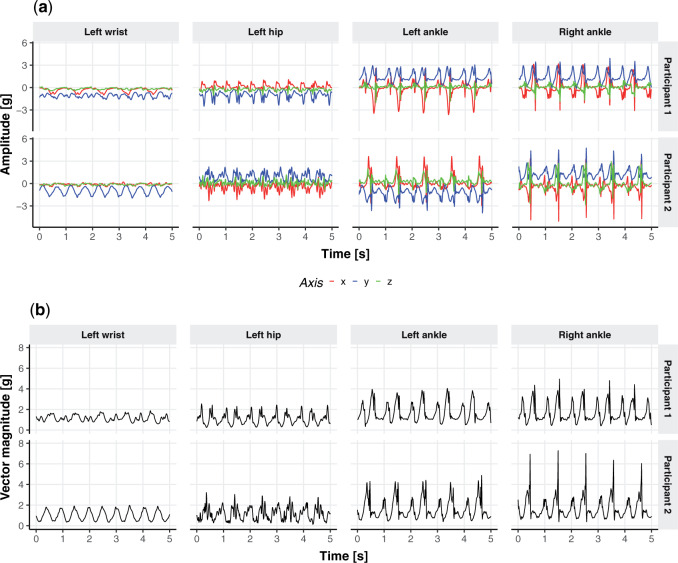
Fig. 1.
(a) Three-dimensional acceleration time series from 5 s of walking for two different study participants (separate row panels) at four body locations: wrist, hip, left, and right ankle (separate column panels). In the online version of the article, a different color (red, blue, and green) corresponds to one of the three orthogonal axes of the device. (b) Same as the (a) panels but showing the vector magnitude, a one-dimensional summary of the three-dimensional time series.

