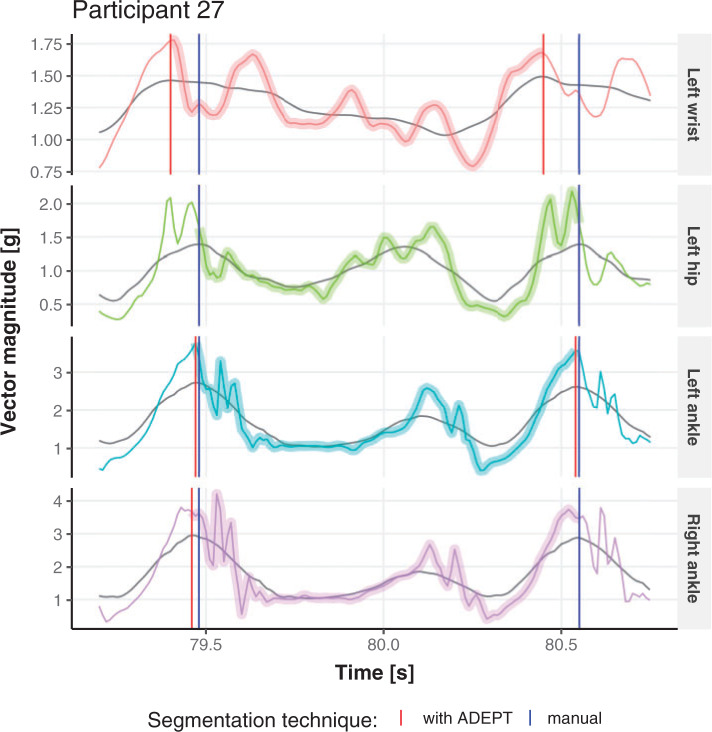
Fig. 4.
Short segments of the vector magnitude and its smoothed version (gray line) for Participant  . Comparing stride segmentation using the manual (blue vertical lines) and ADEPT (red vertical lines) approaches for four different body locations. The color version of the plot is available in the online version of the article.

