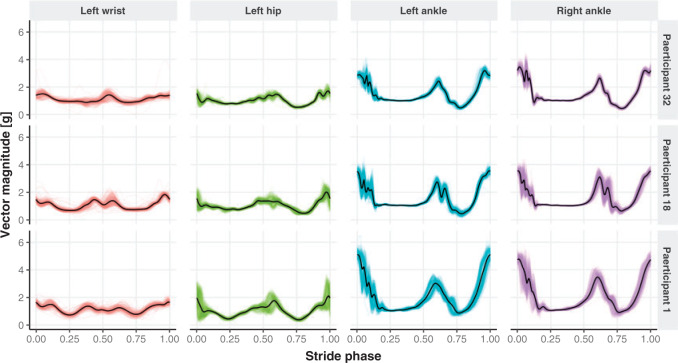
Fig. 5.
Individual strides segmented with the proposed automatic approach (thin colored lines) together with the derived subject- and location-specific stride pattern (black line) for three study participants, across four sensor locations. The color version of the plot is available in the online version of the article.

