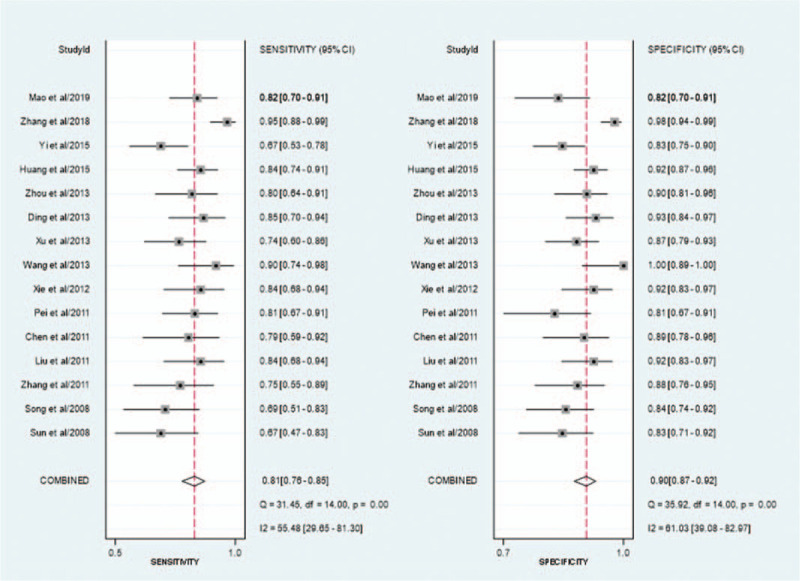
Figure 3.

Forest plot. (A) Forest plot of study–specific estimates of sensitivity (ratio with 95% confidence interval) of CEUS in the diagnosis of EC; (B) Forest plot of study–specific estimates of specificity (ratio with 95% confidence interval) of CEUS in the diagnosis of EC, every plot represents a related study, global results (pooled sensitivity/specificity) are presented at the bottom. The horizontal bars are the CI 95% ranges, and the squares within the bars are the estimate values. CEUS, contrast– enhanced ultrasound; EC, endometrial carcinoma; CI, confidence interval.
