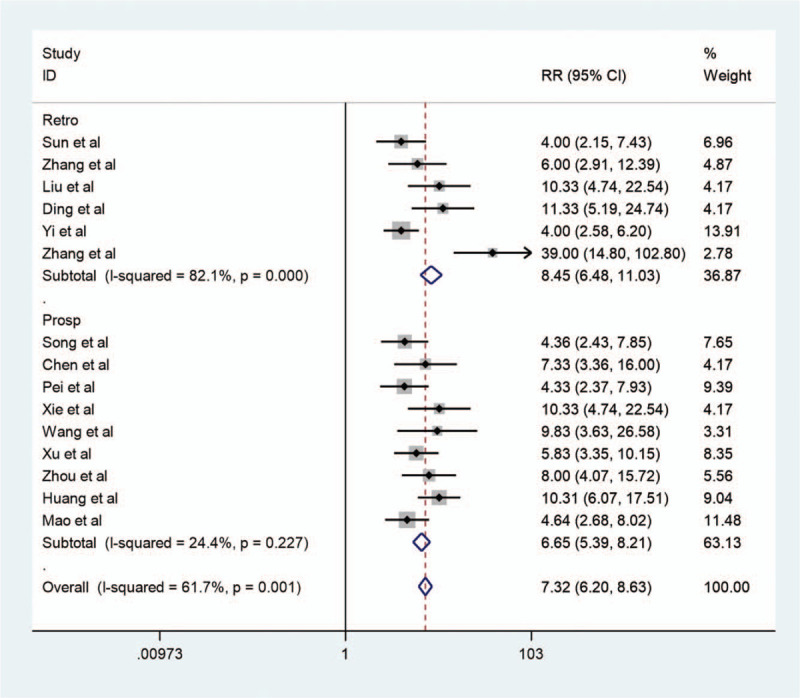
Figure 6.

Forest map of subgroup analysis1. Forest map of subgroup analysis for contrast-enhanced ultrasound in the diagnosis of endometrial carcinoma. Retro = retrospective study; Prosp = prospective study. Black diamonds indicate the weight of each study; blue diamonds indicate the overall result.
