Figure 8.

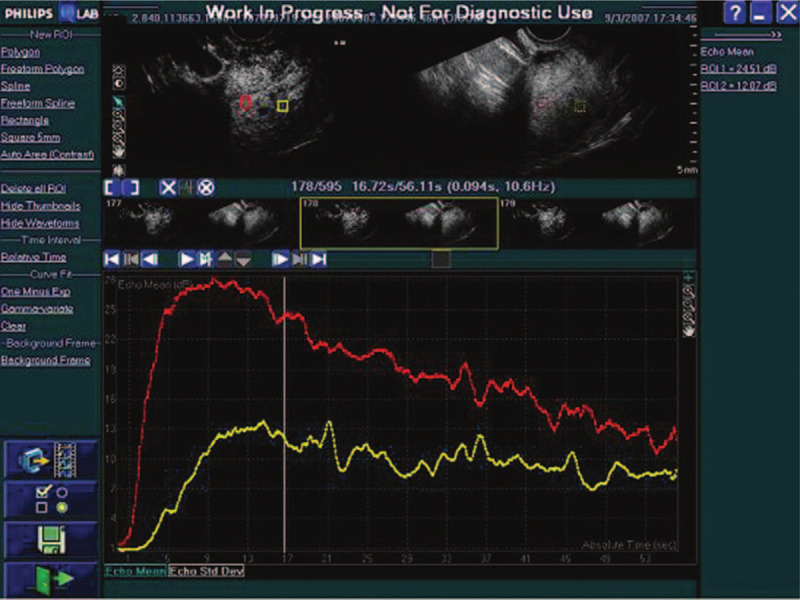
Time–intensity curves. Time–intensity curves derived from contrast-enhanced ultrasonography of tumor and normal myometrium (red: tumor, yellow: normal myometrium).

Time–intensity curves. Time–intensity curves derived from contrast-enhanced ultrasonography of tumor and normal myometrium (red: tumor, yellow: normal myometrium).