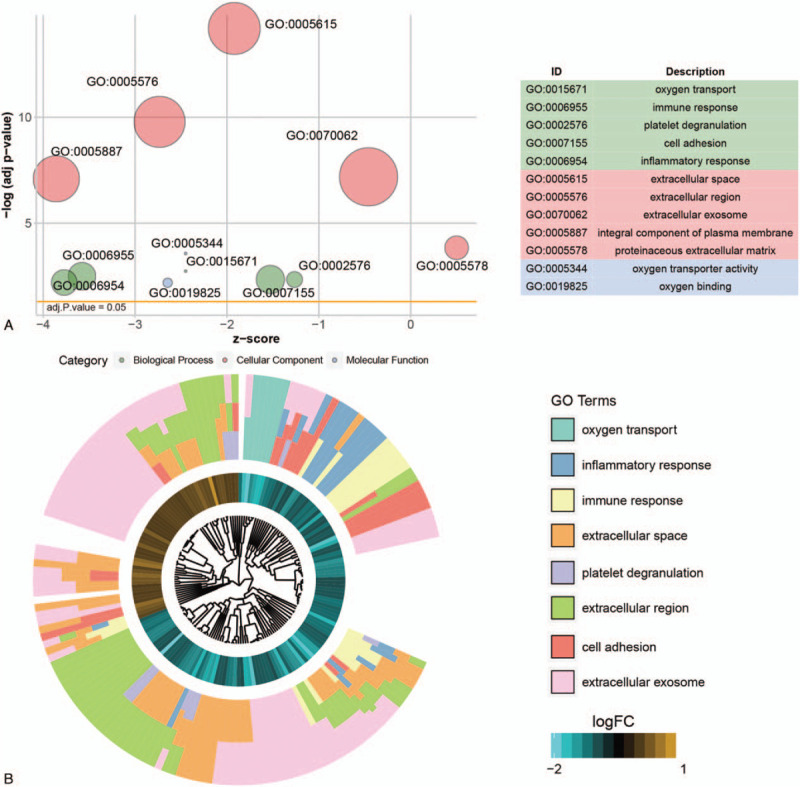
Figure 2.

Gene ontology (GO) enrichment analysis. (A) The bubble plot of GO terms. X-axis represents the Z-score and y-axis represents the negative log adjusted P value. The area of the bubble positively correlates with the gene numbers in the indicated term. The green bubbles represent the GO terms enriched in biological process; the pink bubbles represented the GO terms enriched in cellular component and the blue bubbles represented the molecular function term. (B) GO cluster of genes in the top 8 GO term grouped by their expression level.
