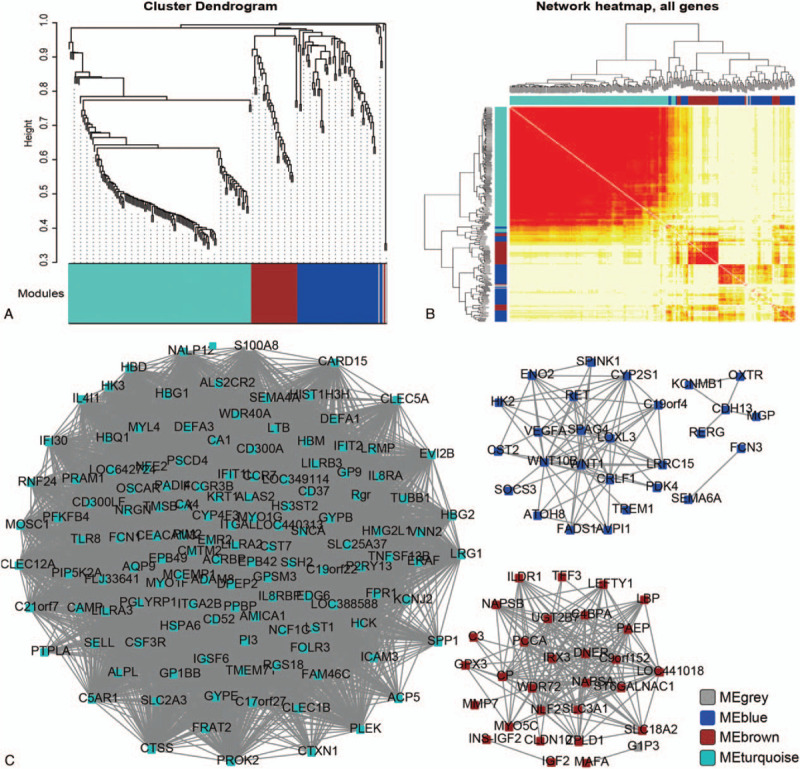
Figure 4.

WGCNA analysis of DEGs. (A) Cluster dendrogram of DEGs in network. Different colors represented different modules. (B) Hierarchical clustering analysis of differently expressed genes. The color in the heatmap indicated correlated degree between the 2 genes. Genes in row and column were analyzed together. Deeper color represented the more correlation. (C) ncRNA-mRNA coexpression network construction. Blue: MEblue module; brown: MEbrown module; turquoise: MEturquoise module.
